The Atlas of Economic Complexity
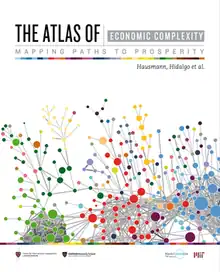
The Atlas of Economic Complexity: Mapping Paths to Prosperity is a 2011 economics book by Ricardo Hausmann, Cesar A. Hidalgo, Sebastián Bustos, Michele Coscia, Sarah Chung, Juan Jimenez, Alexander Simoes and Muhammed A. Yıldırım. A revised 2014 edition is published by the MIT Press.[1]
 2011 paperback cover | |
| Author | Ricardo Hausmann, CA Hidalgo, et al. |
|---|---|
| Country | United States |
| Language | English |
| Subject | Economics |
| Published | 20 June 2011 (Puritan Press) |
| Media type | Print (Hardcover, Paperback), Digital |
| Pages | 364 |
| ISBN | 0615546625 |
The book attempts to measure the amount of productive knowledge that each country holds, by visualizing the differences between national economies. The book's originality is to go beyond standard statistics by making use of “complexity statistics” of 128 countries.[2] The book concludes with hints "at how difficult and complex it may be for government planners to kick-start a new industry — while showing that there are new industries that will struggle to get started without help."[3]
The book is accompanied by two websites that host interactive visualizations and expand upon data featured in the book: MIT's[4] and Harvard's.[5]
The Atlas was a collaboration between the Center for International Development at Harvard University and the Macro Connections group at the MIT Media Lab.
Online visualizations
The visualizations presented in The Atlas were created in The Observatory of Economic Complexity (OEC), a data visualizations engine created by Alex Simoes and Cesar A. Hidalgo in the Macro Connections group at the MIT Media Lab. The Observatory of Economic Complexity was launched in 2011. In 2013, Harvard's Center for International Development released an independent version of the platform, entitled The Atlas of Economic Complexity. The Harvard version builds on the original code base developed by Alex Simoes at the MIT Media Lab and uses a different method for cleaning the data than the OEC.
The Atlas is distributed under a creative commons license which makes it free for non-commercial use.
The Atlas of Economic Complexity (tool)

The data visualizations in Harvard Growth Lab’s Atlas of Economic Complexity map global trade, industrial capabilities, and economic dynamics for the world.
The Atlas follows the Bustos-Yildirim Method for data cleaning the raw data that is reported the United Nations Statisical Division (COMTRADE) and the International Monetary Fund (IMF) Direction of Trade Statistics Database.
It includes data from 250 countries and territories, classified into 20 categories of goods and five categories of services. Combined, this results in coverage of over 6000 products worldwide, with coloured dots representing exports of $100 million.

The Observatory of Economic Complexity (platform)
The OEC is a platform that creates visual narratives about countries and the products each country imports and exports.
The data are from the following data sources, cleaned and made compatible:
- 1962–2000: The Center for International Data from Robert Feenstra
- 2001–2017: UN COMTRADE
References
- Hausmann, Ricardo (2014). The atlas of economic complexity : mapping paths to prosperity. Cambridge, MA: The MIT Press. ISBN 978-0-262-52542-8.
- "'The tricky business of measuring growth'".
- "'The art of economic complexity'".
- https://oec.world/
- Atlas of Economic Complexity
External References
- The Observatory of Economic Complexity (2011)
- The Atlas of Economic Complexity (Online) (2013)
- Ricardo Hausmann, Cesar A. Hidalgo, et al., The Atlas of Economic Complexity, (2011) Puritan Press, Hollis New Hampshire. The Atlas of Economic Complexity
- The Atlas of Economic Complexity (Digital Edition)