Salt tolerance of crops
Salt tolerance of crops is the maximum salt level a crop tolerates without losing its productivity while it is affected negatively at higher levels. The salt level is often taken as the soil salinity or the salinity of the irrigation water.
Salt tolerance is of importance in irrigated lands in (semi)arid regions where the soil salinity problem can be extensive as a result of the salinization occurring here. It concerns hundreds of millions of hectares.[2] A regional distribution of the 3,230,000 km2 of saline land worldwide is shown in salt affected area based on the FAO/UNESCO Soil Map of the World.
Additionally, in areas where sprinkler irrigation is practiced, salty sprinkler water can cause considerable damage by leaf burning, whether the soil is saline or not.[3]
History
One of the first studies made on soil salinity and plant response was published in the USDA Agriculture Handbook No. 60, 1954.[4] More than 20 years later Maas and Hoffman published the results of an extensive study on salt tolerance.[5] In 2001, a Canadian study provided a substantial amount of additional data.[6] A comprehensive survey of tolerances reported worldwide was made by the FAO in 2002.[7]
Most studies were made with pot or drum experiments or in lysimeters under controlled conditions. The collection of field data under farmers' conditions was rare, probably due to the greater efforts and higher costs involved, the lack of control of plant growing conditions other than soil salinity, and the larger random variation in crop yields and soil salinity. Yet, with statistical methods, it is possible to detect the tolerance level from field data.[1][8][9] Salt Farm Texel, a Dutch-based research company has identified various crops that have considerable amount of salt tolerance.[10]
Classification
Soil and water salinity can be expressed in various ways. The most common parameter used in soil salinity is the electric conductivity of the extract (ECe) of a saturated soil paste in units of deciSiemens per metre (dS/m) (previously measured in millimhos per centimeter (mmho/cm)). Bernstein presented the following soil classification based on ECe in dS/m:[11]
ECe 0–2 non-saline soil
ECe 2–4 slightly saline, yield of sensitive crops reduced
ECe 4–8 moderately saline, yield reduction of many crops
ECe 8–16 saline, normal yield for salt tolerant crops only
ECe > 16 reasonable crop yields only for very tolerant crops
Modeling
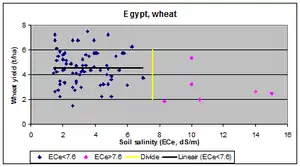
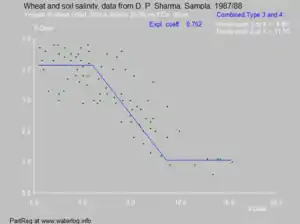
A common way to present crop – salinity data is according to the Maas–Hoffman model (see above figure): initially a horizontal line connected to a downward sloping line. The breakpoint is also called threshold or tolerance. For field data with random variation the tolerance level can be found with segmented regression.[13] As the Maas-Hoffman model is fitted to the data by the method of least squares, the data at the tail-end influence the position of the breakpoint.
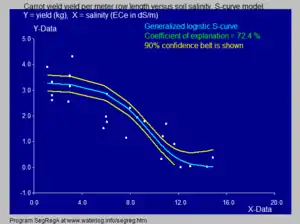
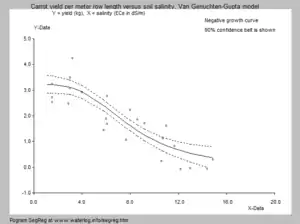
Another method was described by Van Genuchten and Gupta.[14] It uses an inverted S-curve as shown in the left-hand figure. This model recognizes that the tail-end may have a flatter slope than the middle part. It does not provide a sharp tolerance level.
Using the Maas–Hoffman model in situations with a flat trend in the tail-end may lead to a breakpoint with a low ECe value, owing to the employment of the condition to minimize the deviations of the model values from the observed values over the entire domain (i.e. including the tail-end).
Using the logistic sigmoid function for the same data applied in the van Genuchten-Gupta model, the curvature becomes more pronounced and a better fit is obtained.
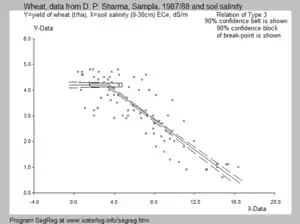
A third model is based on the method of partial regression,[15] whereby one finds the longest horizontal stretch (the range of no effect) of the yield-ECe relation while beyond that stretch the yield decline sets in (figure below). With this method the trend at the tail-end plays no role. As a result, the tolerance level (breakpoint, threshold) is larger (4.9 dS/m) than according to the Maas-Hoffman model (3.3 dS/m, see the second figure above with the same data). Also a better fit is achieved.[16][17]
Augmenting tolerance
Presently a considerable amount of research is undertaken to develop agricultural crops with a higher salt tolerance to enhance crop cultivation in salinity stricken regions.[18]
Leaf damage
In Australia the following classification of sprinkler irrigation water salinity was developed:[3]
| Sensitivity | Chloride (mg/L) | Sodium (mg/L) | Affected crop |
|---|---|---|---|
| Sensitive | <178 | <114 | Almond, apricot, citrus, plum |
| Moderately Sensitive | 178–355 | 114–229 | Capsicum, grape, potato, tomato |
| Moderately tolerant | 355–710 | 229–458 | Barley, cucumber, sweetcorn |
| Tolerant | >710 | >458 | Cauliflower, cotton, safflower, sesame, sorghum, sunflower |
See also
- Biosalinity – Use of salty water for irrigation
- Crop tolerance to seawater – Crop tolerance to seawater is the ability of an agricultural crop to withstand the high salinity induced by irrigation with seawater.
- Halophyte – Salt-tolerant plant
- Halotolerance – Adaptation to high salinity
- Sea level rise – Rise in sea levels due to climate change
- Sodium in biology – Use of Sodium by organisms
- Soil salinity – Salt content in the soil
- Soil salinity control – Controlling the problem of soil salinity
References
- H.J. Nijland and S. El Guindy, Crop yields, watertable depth and soil salinity in the Nile Delta, Egypt. In: Annual report 1983, International Institute for Land Reclamation and Improvement (ILRI), Wageningen, The Netherlands.
- R.Brinkman, 1980. Saline and sodic soils. In: Land reclamation and water management, p. 62–68. International Institute for Land Reclamation and Improvement (ILRI), Wageningen, The Netherlands.
- Government of Western Australia, Department of Agriculture and Food. Water salinity and plant irrigation.
- L. A. Richards, Editor, 1954, Diagnosis and Improvement of saline and alkali soil, Agriculture Handbook No. 60, USDA
- Maas EV, Hoffman GJ, 1977. Crop salt tolerance-current assessment. Journal of the Irrigation and Drainage Division, American Society of Civil Engineers 103: 115–134.
- Alberta Ministry of Agriculture and Forestry, 2001, Salt Tolerance of Plants
- Tanji KK, Kielen NC. 2002. Agricultural drainage water management in arid and semi-arid areas. FAO irrigation and drainage paper 61. FAO, Rome.
- D.P. Sharma, K.N. Singh and K.V.G.K Rao (1990), Crop Production and soil salinity: evaluation of field data from India. Paper published in Proceedings of the Symposium on Land Drainage for Salinity Control in Arid and Semi-Arid Regions, February 25th to March 2nd, 1990, Cairo, Egypt, Vol. 3, Session V, p. 373 – 383. On line:
- R.J. Oosterbaan, Crop yields, soil salinity and water table depth in Pakistan. In: Annual Report 1981, p. 50-54. ILRI, Wageningen, The Netherlands. Reprinted in Indus 24 (1983) 2, p. 29 – 33. On line:
- De Vos A, Bruning B, van Straten G, Oosterbaan R, Rozema J, van Bodegom P (2016). "Crop salt tolerance" (PDF).
- Bernstein, L., 1964. Salt tolerance of plants. In: Agric. Inf. Bulletin. no. 283, USDA
- Method for sigmoidal (S-curve) regression
- A method for segmented regression
- Van Genuchten M.Th and S.K.Gupta. 1993. A reassessment of the crop tolerance response function. Journal of the Indian Society of Soil Science, Vol. 41, No. 4, pp 730–737
- "Method of partially segmented regression".
- Various authors, Crop Yield and soil salinity in farmers' fields; data form Egypt, India and Pakistan used to find salt tolerance of crops measured in farmers' fields
- Oosterbaan, R. J. (October 2018). "Crop Tolerance to Soil Salinity, Statistical Analysis of Data Measured in Farm Lands" (PDF). International Journal of Agricultural Science. 3: 57–66.
- Flowers, T. J. (2004). "Improving crop salt tolerance". Journal of Experimental Botany. 55 (396): 307–319. doi:10.1093/jxb/erh003. ISSN 1460-2431. PMID 14718494.
