Salford East (UK Parliament constituency)
Salford East was a parliamentary constituency in the City of Salford in Greater Manchester. It returned one Member of Parliament (MP) to the House of Commons of the Parliament of the United Kingdom.
| Salford East | |
|---|---|
| Former Borough constituency for the House of Commons | |
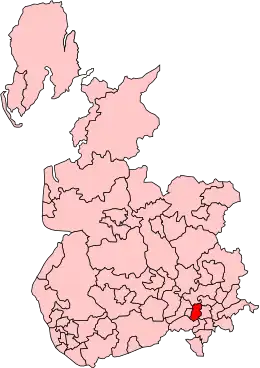
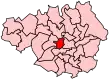 Salford East in Greater Manchester, showing boundaries used from 1983-1997 | |
| 1950–1997 | |
| Seats | one |
| Created from | Salford North and Salford South |
| Replaced by | Salford |
The constituency was created for the 1950 general election, and abolished for the 1997 general election, when it was partially replaced by the new Salford constituency.
Boundaries
1950–1983: The County Borough of Salford wards of Albert Park, Crescent, Kersal, Mandley Park, Ordsall Park, Regent, St Matthias, and Trinity.
1983–1997: The City of Salford wards of Blackfriars, Broughton, Claremont, Kersal, Langworthy, Ordsall, and Pendleton.
Members of Parliament
| Election | Member[1] | Party | |
|---|---|---|---|
| 1950 | Edward Hardy | Labour | |
| 1955 | Frank Allaun | Labour | |
| 1983 | Stan Orme | Labour | |
| 1997 | constituency abolished: see Salford | ||
Elections
Elections in the 1950s
| Party | Candidate | Votes | % | ±% | |
|---|---|---|---|---|---|
| Labour | Edward Hardy | 26,783 | 54.2 | ||
| Conservative | W. Sinclair | 18,625 | 37.6 | ||
| Liberal | Sydney Needoff | 4,057 | 8.2 | ||
| Majority | 8,158 | 16.6 | |||
| Turnout | 49,465 | 81.1 | |||
| Labour win (new seat) | |||||
| Party | Candidate | Votes | % | ±% | |
|---|---|---|---|---|---|
| Labour | Edward Hardy | 27,729 | 57.0 | +2.8 | |
| Conservative | John E Parkinson | 20,951 | 43.0 | +5.4 | |
| Majority | 6,778 | 14.0 | -2.6 | ||
| Turnout | 48,680 | 79.7 | −1.4 | ||
| Labour hold | Swing | −1.3 | |||
| Party | Candidate | Votes | % | ±% | |
|---|---|---|---|---|---|
| Labour | Frank Allaun | 20,351 | 52.2 | −4.8 | |
| Conservative | John Whiteley | 18,623 | 47.8 | +4.8 | |
| Majority | 1,728 | 4.4 | -9.6 | ||
| Turnout | 38,974 | 69.8 | −9.9 | ||
| Labour hold | Swing | −4.8 | |||
| Party | Candidate | Votes | % | ±% | |
|---|---|---|---|---|---|
| Labour | Frank Allaun | 20,639 | 54.6 | +2.4 | |
| Conservative | John Higham Franks | 17,171 | 45.4 | −2.4 | |
| Majority | 3,468 | 9.2 | +4.8 | ||
| Turnout | 37,810 | 73.8 | +4.0 | ||
| Labour hold | Swing | +2.4 | |||
Elections in the 1960s
| Party | Candidate | Votes | % | ±% | |
|---|---|---|---|---|---|
| Labour | Frank Allaun | 19,641 | 61.1 | +6.5 | |
| Conservative | John H. Franks | 12,498 | 38.9 | −6.5 | |
| Majority | 7,143 | 22.2 | +13.0 | ||
| Turnout | 32,139 | 66.8 | −7.0 | ||
| Labour hold | Swing | +6.5 | |||
| Party | Candidate | Votes | % | ±% | |
|---|---|---|---|---|---|
| Labour | Frank Allaun | 18,409 | 67.2 | +6.1 | |
| Conservative | Gerald W.G. FitzSimons | 9,000 | 32.8 | −6.1 | |
| Majority | 9,409 | 34.4 | +12.2 | ||
| Turnout | 27,409 | 61.1 | −5.7 | ||
| Labour hold | Swing | +6.1 | |||
Elections in the 1970s
| Party | Candidate | Votes | % | ±% | |
|---|---|---|---|---|---|
| Labour | Frank Allaun | 15,853 | 55.8 | −11.4 | |
| Conservative | John Bryan Leck | 9,583 | 33.7 | +0.9 | |
| Liberal | Allan Stewart Bell | 3,000 | 10.6 | New | |
| Majority | 6,270 | 22.1 | -12.3 | ||
| Turnout | 28,436 | 62.2 | +1.1 | ||
| Labour hold | Swing | −6.2 | |||
| Party | Candidate | Votes | % | ±% | |
|---|---|---|---|---|---|
| Labour | Frank Allaun | 14,426 | 54.5 | −1.3 | |
| Conservative | Betty Knightly | 7,495 | 28.3 | −5.4 | |
| Liberal | Howard Watkin | 4,536 | 17.1 | +6.5 | |
| Majority | 6,931 | 26.2 | +4.1 | ||
| Turnout | 26,457 | 66.4 | +4.2 | ||
| Labour hold | Swing | +2.1 | |||
| Party | Candidate | Votes | % | ±% | |
|---|---|---|---|---|---|
| Labour | Frank Allaun | 14,276 | 59.8 | +5.3 | |
| Conservative | Stephen Reid Latimer | 6,440 | 27.0 | −1.3 | |
| Liberal | Allan Stewart Bell | 3,160 | 13.2 | −3.9 | |
| Majority | 7,836 | 32.8 | +6.6 | ||
| Turnout | 23,876 | 59.5 | −6.9 | ||
| Labour hold | Swing | +3.3 | |||
| Party | Candidate | Votes | % | ±% | |
|---|---|---|---|---|---|
| Labour | Frank Allaun | 13,453 | 63.9 | +4.1 | |
| Conservative | Stephen Reid Latimer | 7,597 | 36.1 | +9.1 | |
| Majority | 5,856 | 27.8 | -5.0 | ||
| Turnout | 21,050 | 64.3 | +4.8 | ||
| Labour hold | Swing | −2.5 | |||
Elections in the 1980s
| Party | Candidate | Votes | % | ±% | |
|---|---|---|---|---|---|
| Labour | Stan Orme | 21,373 | 53.7 | −9.3 | |
| Conservative | Simon Cole | 11,832 | 29.7 | −6.7 | |
| SDP | Adrian C. Williams | 6,190 | 15.6 | New | |
| Workers Revolutionary | Stuart Carter | 417 | 1.1 | New | |
| Majority | 9,541 | 24.0 | |||
| Turnout | 39,812 | 62.3 | |||
| Labour hold | Swing | ||||
Note: This constituency underwent major boundary changes for the 1983 election and so changes are based on notional figures.
| Party | Candidate | Votes | % | ±% | |
|---|---|---|---|---|---|
| Labour | Stan Orme | 22,555 | 58.8 | +5.1 | |
| Conservative | Charles McFall | 10,499 | 27.4 | −2.3 | |
| SDP | Patrick Keaveney | 5,105 | 13.3 | −2.3 | |
| Workers Revolutionary | Stephen Murray | 201 | 0.5 | −0.6 | |
| Majority | 12,056 | 31.4 | +7.4 | ||
| Turnout | 38,360 | 66.0 | +3.7 | ||
| Labour hold | Swing | +3.7 | |||
Elections in the 1990s
| Party | Candidate | Votes | % | ±% | |
|---|---|---|---|---|---|
| Labour | Stan Orme | 20,327 | 60.0 | +1.2 | |
| Conservative | David A. Berens | 9,092 | 26.8 | −0.6 | |
| Liberal Democrats | Norman J. Owen | 3,836 | 11.3 | −2.0 | |
| Green | Mark T. Stanley | 463 | 1.4 | New | |
| Natural Law | Christopher C.B. Craig | 150 | 0.4 | New | |
| Majority | 11,235 | 33.2 | +1.8 | ||
| Turnout | 33,868 | 64.4 | −1.6 | ||
| Labour hold | Swing | +0.9 | |||
Notes and references
- Leigh Rayment's Historical List of MPs – Constituencies beginning with "S" (part 1)
- "Election Data 1983". Electoral Calculus. Archived from the original on 15 October 2011. Retrieved 28 June 2017.
- "Election Data 1987". Electoral Calculus. Archived from the original on 15 October 2011. Retrieved 28 June 2017.
- "Election Data 1992". Electoral Calculus. Archived from the original on 15 October 2011. Retrieved 28 June 2017.
- "UK General Election results April 1992". Richard Kimber's Political Science Resources. Politics Resources. 9 April 1992. Retrieved 6 December 2010.