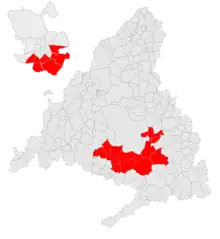
Red belt (Community of Madrid)
The expression red belt (Spanish: Cinturón rojo) is used to designate in the Community of Madrid, since the return to democracy in the last decades of the 20th century, the set of cities located in the southern part of the metropolitan area of the city of Madrid, characterized by their high population of workers or working class and because of their long history with mayors of the Spanish Socialist Workers Party or other left parties and coalitions such as the Communist Party of Spain or the United Left, representing a total of 21% of the population residing in the Community of Madrid, with six out of the ten most populated municipalities of the region belonging to the red belt.[1][2][3][4] The name is also used to talk about the southern districts of the city of Madrid.[5]

As of the 2010s, there was also talk in this country of a "purple belt" in reference to the emergence, with a notable implantation in the red belt, of the new Podemos party, whose color is purple instead of the traditional red of the left-wing parties.[6][7][8]
Municipalities of the Madrilenian «red belt»
| Municipality | Population (2021)[9] | Current mayor | Term start | Party (2023-2027) | Parties in local government since 1979 | |||
 |
Alcorcón | _mapa.svg.png.webp) |
170 817 (7th) | Candelaria Testa | 2023 | PSOE
(Coalition) |
||
 |
Arganda del Rey | _mapa.svg.png.webp) |
56 386 (21st) | Alberto Escribano | 2023 | PP
(Coalition) |
||
 |
Coslada | _mapa.svg.png.webp) |
81 273 (15th) | Ángel Viveros | 2015 | PSOE
(Coalition) |
| |
| Fuenlabrada | _mapa.svg.png.webp) |
192 233 (4th) | Javier Ayala | 2018 | PSOE
(Majority) |
|||
| Getafe | _mapa.svg.png.webp) |
183 095 (6th) | Sara Hernández | 2015 | PSOE
(Coalition) |
|||
| Leganés | _mapa.svg.png.webp) |
187 762 (5th) | Miguel Ángel Recuenco | 2023 | PP
(Coalition) |
|||
| Mejorada del Campo | _mapa.svg.png.webp) |
23 737 (33rd) | Jorge Capa | 2015 | PSOE
(Majority) |
|||
| Móstoles | _mapa.svg.png.webp) |
209 639 (2nd) | Manuel Bautista | 2023 | PP
(Coalition) |
|||
| Parla | _mapa.svg.png.webp) |
131 689 (9th) | Ramón Jurado | 2019 | PSOE
(Coalition) |
|||
| Pinto | _mapa.svg.png.webp) |
53 537 (22nd) | Salomón Aguado | 2023 | PP
(Coalition) |
|||
| Rivas-Vaciamadrid | _mapa.svg.png.webp) |
92 925 (12th) | Aída Castillejo | 2022 | IU
(Coalition) |
|||
 |
San Fernando de Henares | _mapa.svg.png.webp) |
39 313 (25th) | Francisco Javier Corpa | 2019 | PSOE
(Majority) |
||
 |
San Martín de la Vega | _mapa.svg.png.webp) |
19 853 (36th) | Rafael Martínez | 2015 | PSOE
(Majority) |
||
 |
Velilla de San Antonio | _mapa.svg.png.webp) |
12 542 (48th) | Antonia Alcázar | 2015 | PSOE
(Coalition) |
||
Notes and references
- Oliveres, Victòria (2021-04-30). "Cómo la izquierda recuperó el cinturón rojo madrileño sumando al PSOE el auge de Podemos y Más Madrid". ElDiario.es (in Spanish). Retrieved 2021-05-10.
- "Descalabro del PSOE en sus feudos del 'cinturón rojo' de Madrid". ELMUNDO (in Spanish). 2021-05-04. Retrieved 2021-05-10.
- PLAZA, ANA MARTÍN (2021-05-08). "Elecciones Madrid 4M: La izquierda se desdibuja en el cinturón rojo de Madrid". RTVE.es (in Spanish). Retrieved 2021-05-10.
- H, Creada 18-04-2021 | 02:21 H/Última actualización 18-04-2021 | 23:09 (2021-04-18). "Del azul al rojo en diez años: así ha cambiado el mapa político de Madrid". La Razón (in Spanish). Retrieved 2021-05-10.
- Peinado, Fernando (2021-05-04). "Ayuso erosiona el cinturón rojo de la capital". EL PAÍS (in Spanish). Retrieved 2021-05-10.
- "Iglesias apela al 'cinturón morado' para 'echar a Mas'". ELMUNDO (in Spanish). 2015-09-15. Retrieved 2021-05-10.
- CALLEJA, TONO; González, Jesús Sérvulo (2011-06-11). "Adiós al cinturón rojo". El País (in Spanish). ISSN 1134-6582. Retrieved 2021-05-10.
- Escribano, Mario (2019-05-02). "El PSOE recupera el 'cinturón rojo' de Madrid a menos de un mes de las municipales". ElDiario.es (in Spanish). Retrieved 2021-05-10.
- "Madrid (España): Provincia & Municipios - Estadísticas de población, gráficos y mapa". www.citypopulation.de. Retrieved 2022-11-15.