Ohio's 2nd congressional district
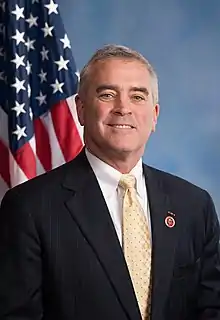
Ohio's 2nd congressional district is a district in southern Ohio. It is currently represented by Republican Brad Wenstrup.
| Ohio's 2nd congressional district | |||
|---|---|---|---|
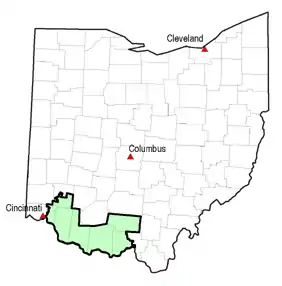
Interactive map of district boundaries since January 3, 2023 | |||
| Representative |
| ||
| Distribution |
| ||
| Population (2022) | 786,489[2] | ||
| Median household income | $61,589[3] | ||
| Ethnicity |
| ||
| Cook PVI | R+25[4] | ||
.svg.png.webp)
The district includes all of Adams, Brown, Pike, Clermont, Highland, Clinton, Ross, Pickaway, Hocking, Vinton, Jackson, Gallia, Meigs, Lawrence, and Scioto counties, as well as parts of Fayette county. With a Cook Partisan Voting Index rating of R+25, it is the most Republican district in Ohio.[4]
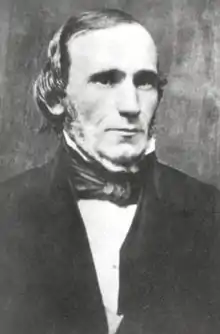
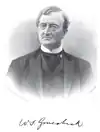
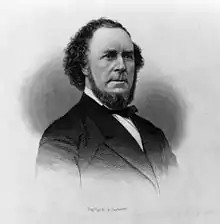
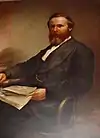
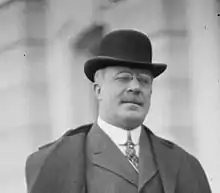
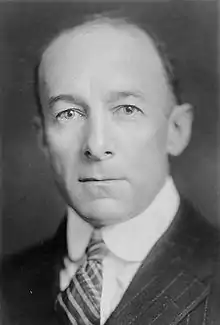
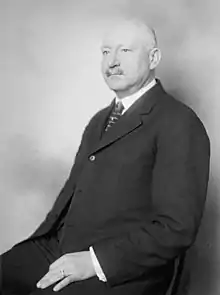
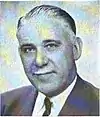
List of members representing the district
.jpg.webp)

.jpg.webp)


Election results
The following chart shows historic election results.
| Year | Democratic | Republican | Other |
|---|---|---|---|
| 1920 | Thomas H. Morrow: 41,781 | John Partridge: 1,291 | |
| 1922 | John R. Quane: 30,051 | Charles A. Herbst (FL): 4,001 | |
| 1924 | Robert J. O'Donnell: 34,118 | ||
| 1926 | Robert J. O'Donnell: 26,322 | ||
| 1928 | James H. Cleveland: 54,332 | ||
| 1930 | Charles W. Sawyer: 45,761 | ||
| 1932 | Edward F. Alexander: 57,258 | ||
| 1934 | Charles E. Miller: 41,701 | ||
| 1936 | William E. Hess (Incumbent): 62,546 | ||
| 1938 | Herbert S. Bigelow (Incumbent): 42,773 | ||
| 1940 | James E. O'Connell: 60,410 | ||
| 1942 | Nicholas Bauer: 29,823 | ||
| 1944 | J. Harry Moore: 61,473 | ||
| 1946 | Francis G. Davis: 39,112 | ||
| 1948 | William E. Hess (Incumbent): 66,968 | ||
| 1950 | Earl T. Wagner (Incumbent): 62,542 | ||
| 1952 | Earl T. Wagner: 69,341 | ||
| 1954 | Earl T. Wagner: 49,690 | ||
| 1956 | James T. Dewan: 57,554 | ||
| 1958 | James O. Bradley: 71,674 | ||
| 1960 | H. A. Sand: 87,531 | ||
| 1962 | H. A. Sand: 62,733 | ||
| 1964 | H. A. Sand: 79,824 | ||
| 1966 | Thomas E. Anderson: 42,367 | ||
| 1968 | Don Driehaus: 52,327 | ||
| 1970 | Gerald N. "Jerry" Springer: 60,860 | ||
| 1972 | Penny Manes: 65,237 | ||
| 1974 | Edward W. Wolterman: 67,685 | ||
| 1976 | Donald D. Clancy (Incumbent): 83,459 | ||
| 1978 | Stanley J. Aronoff: 58,716 | ||
| 1980 | Thearon "Tom" Atkins: 72,693 | ||
| 1982 | William J. Luttmer: 53,169 | Joseph I. Lombardo: 1,827 Charles K. Shrout Jr. (L): 2,948 | |
| 1984 | Thomas J. Porter: 68,597 | ||
| 1986 | William F. Stineman: 43,448 | ||
| 1988 | Chuck R. Stidham: 58,637 | ||
| 1990 | Tyrone K. Yates: 57,345 | ||
| 1992 | Thomas R. Chandler: 75,924 | ||
| 1993 (Special)[lower-alpha 2] | Lee Hornberger: 22,652 | ||
| 1994 | Les Mann: 43,730 | ||
| 1996 | Thomas R. Chandler: 58,715 | Kathleen M. McKnight (N): 13,905 | |
| 1998 | Charles W. Sanders: 49,293 | ||
| 2000 | Charles W. Sanders: 64,091 | Robert E. Bidwell (L): 9,266 | |
| 2002 | Charles W. Sanders: 48,785 | ||
| 2004 | Charles W. Sanders: 87,156 | ||
| 2005 (Special)[lower-alpha 3] | Paul Hackett: 55,151 | ||
| 2006 | Victoria Wulsin: 117,595 | ||
| 2008 | Victoria Wulsin: 124,076 | David Krikorian: 58,650; James Condit: 30 | |
| 2010 | Surya Yalamanchili: 80,139 | Marc Johnson (Libertarian) 15,867 | |
| 2012[5] | William Smith: 137,082 | ||
| 2014[6] | Marek Tyszkiewicz: 68,453 | ||
| 2016[7] | William Smith: 111,694 | Janet Everhard (write-in Dem): 7,392 | |
| 2018 | Jill Schiller: 119,333 | Jim Condit Jr.: 3,608; David Baker: 8 | |
| 2020 | Jaime Castle: 146,781 | ||
| 2022[8] | Samantha Meadows: 64,329 |
2005 special election
The district has not elected a Democrat since Tom Luken won a 1974 special election.
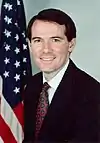
On August 2, 2005, elections were held to choose a United States representative to replace Rob Portman, who resigned his seat on April 29, 2005, to become United States Trade Representative. Republican Jean Schmidt candidate defeated Democrat Paul Hackett in a surprisingly close election.
2006
Schmidt defeated Democrat Victoria Wells Wulsin, a doctor from Indian Hill, in the November general election.
2010
| Party | Candidate | Votes | % | |
|---|---|---|---|---|
| Republican | Jean Schmidt* | 139,027 | 58.45 | |
| Democratic | Surya Yalamanchili | 82,431 | 34.66 | |
| Libertarian | Marc Johnston | 16,259 | 6.84 | |
| Total votes | 237,717 | 100.00 | ||
| Turnout | ||||
| Republican hold | ||||
2012
| Party | Candidate | Votes | % | |
|---|---|---|---|---|
| Republican | Brad Wenstrup | 194,296 | 58.6 | |
| Democratic | William Smith | 137,077 | 41.4 | |
| Total votes | 331,373 | 100.0 | ||
| Republican hold | ||||
2014
| Party | Candidate | Votes | % | |
|---|---|---|---|---|
| Republican | Brad Wenstrup (incumbent) | 132,658 | 66.0 | |
| Democratic | Marek Tyszkiewicz | 68,453 | 34.0 | |
| Total votes | 201,111 | 100.0 | ||
| Republican hold | ||||
2016
| Party | Candidate | Votes | % | |
|---|---|---|---|---|
| Republican | Brad Wenstrup (incumbent) | 221,193 | 65.0 | |
| Democratic | William R. Smith | 111,694 | 32.8 | |
| Independent | Janet Everhard (write-in) | 7,392 | 2.2 | |
| Total votes | 340,279 | 100.0 | ||
| Republican hold | ||||
2018
| Party | Candidate | Votes | % | ||
|---|---|---|---|---|---|
| Republican | Brad Wenstrup (incumbent) | 166,714 | 57.6 | ||
| Democratic | Jill Schiller | 119,333 | 41.2 | ||
| Green | Jim Condit Jr. | 3,606 | 1.2 | ||
| Independent | David Baker (write-in) | 8 | 0.0 | ||
| Total votes | 289,661 | 100.0 | |||
| Republican hold | |||||
2020
| Party | Candidate | Votes | % | ||
|---|---|---|---|---|---|
| Republican | Brad Wenstrup (incumbent) | 230,430 | 61.1 | ||
| Democratic | Jaime Castle | 146,781 | 38.9 | ||
| Write-in | 37 | 0.0 | |||
| Total votes | 377,248 | 100.0 | |||
| Republican hold | |||||
2022
| Party | Candidate | Votes | % | ||
|---|---|---|---|---|---|
| Republican | Brad Wenstrup (incumbent) | 192,117 | 74.5 | ||
| Democratic | Samantha Meadows | 65,745 | 25.5 | ||
| Total votes | 257,862 | 100.0 | |||
| Republican hold | |||||
Recent statewide election results
Election results from presidential races:
| Year | Office | Results |
|---|---|---|
| 2000 | President | George W. Bush 63 - Al Gore 34% |
| 2004 | President | George W. Bush 64 - John Kerry 36% |
| 2008 | President | John McCain 59 - Barack Obama 40% |
| 2012 | President | Mitt Romney 55 - Barack Obama 44% |
| 2016 | President | Donald Trump 56 - Hillary Clinton 40% |
| 2020 | President | Donald Trump 55 - Joe Biden 42% |
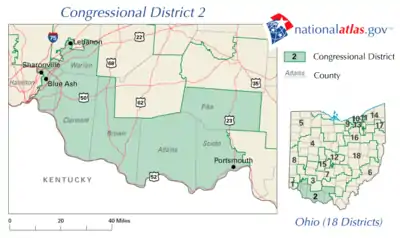
Historical district boundaries
.tif.png.webp)
Notes
- Redistricting following the 1980 census moved Luken from the 2nd district to this district and Gradison from the first district to the 2nd district.
- In May 1993, a special election was held to fill the seat to replace Bill Gradison who, three months after his re-election, resigned on January 31, 1993, to become a lobbyist for the insurance industry as president of the Health Insurance Association of America.
- In 2005, a special election was required to fill the seat following Portman's resignation to accept nomination to the office of United States Trade Representative.
References
- "Congressional Districts Relationship Files (State-based)". U.S. Census Bureau. Archived from the original on April 2, 2013.
- "My Congressional District".
- "My Congressional District".
- "2022 Cook PVI: District Map and List". Cook Political Report. Retrieved January 10, 2023.
- "2012 Election Results". Ohio Secretary of State.
- "2014 Election Results". Ohio Secretary of State.
- "2016 Official Elections Results". www.sos.state.oh.us. Retrieved January 2, 2017.
- "Ohio's 2nd Congressional District election, 2022". Ballotpedia. Retrieved May 9, 2023.
- Martis, Kenneth C. (1989). The Historical Atlas of Political Parties in the United States Congress. New York: Macmillan Publishing Company.
- Martis, Kenneth C. (1982). The Historical Atlas of United States Congressional Districts. New York: Macmillan Publishing Company.
- Congressional Biographical Directory of the United States 1774–present