Ohio's 7th congressional district
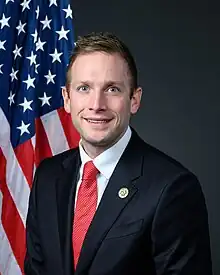
Ohio's 7th congressional district is represented by Max Miller. It is currently located in the northeastern section of the state, including southern and western Cuyahoga County, all of Medina and Wayne Counties, and a sliver of northern Holmes County.
| Ohio's 7th congressional district | |||
|---|---|---|---|
Interactive map of district boundaries since January 3, 2023 | |||
| Representative |
| ||
| Population (2022) | 774,125[1] | ||
| Median household income | $81,160[2] | ||
| Ethnicity |
| ||
| Cook PVI | R+7[3] | ||
Election results from statewide races
| Year | Office | Result |
|---|---|---|
| 2000 | President | George W. Bush 56% - Al Gore 42% |
| 2004 | President | George W. Bush 57% - John Kerry 43% |
| 2008 | President | John McCain 50.9% - Barack Obama 46.9% |
| 2012 | President | Mitt Romney 53.7% - Barack Obama 44.2% |
| 2016 | President | Donald Trump 62.5% - Hillary Clinton 32.8% |
| 2020 | President | Donald Trump 65% - Joe Biden 33% |
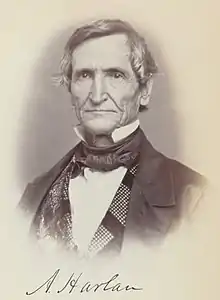
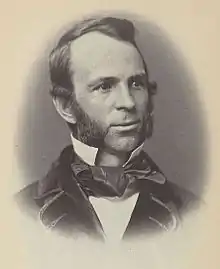
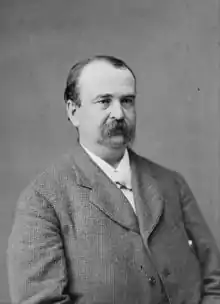
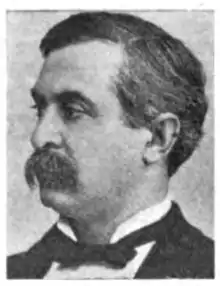
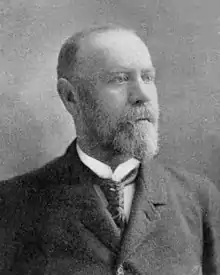
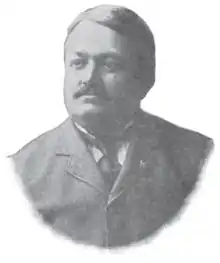
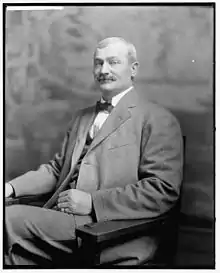
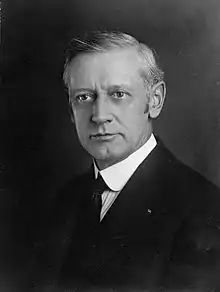
List of members representing the district
Recent election results
The following chart shows historic election results. Bold type indicates victor. Italic type indicates incumbent.
| Year | Democratic | Republican | Other |
|---|---|---|---|
| 1920 | Paul F. Dye: 47,196 | Simeon D. Fess: 73,794 | |
| 1922 | Charles B. Zimmerman: 38,522 | Charles Brand: 53,182 | |
| 1924 | C. K. Wolf: 34,709 | Charles Brand: 61,557 | |
| 1926 | Harry E. Rice: 22,314 | Charles Brand: 45,699 | |
| 1928 | Harry E. Rice: 34,323 | Charles Brand: 75,753 | |
| 1930 | John L. Zimmerman Jr.: 35,663 | Charles Brand: 50,595 | |
| 1932 | Aaron J. Halloran: 57,715 | Leroy T. Marshall: 65,064 | |
| 1934 | C. W. Rich: 43,226 | Leroy T. Marshall: 46,453 | |
| 1936 | Arthur W. Aleshire: 68,456 | Leroy T. Marshall: 67,454 | |
| 1938 | Arthur W. Aleshire: 50,163 | Clarence J. Brown: 68,185 | |
| 1940 | J. Fuller Trump: 59,667 | Clarence J. Brown: 83,415 | |
| 1942 | George H. Smith: 23,384 | Clarence J. Brown: 52,270 | |
| 1944 | John L. Cashim: 52,403 | Clarence J. Brown: 84,770 | Carl H. Ehl: 211 |
| 1946 | Carl H. Ehl: 29,824 | Clarence J. Brown: 63,390 | |
| 1948 | Clarence J. Brown: 71,737 | ||
| 1950 | Ben J. Goldman: 35,818 | Clarence J. Brown: 77,660 | |
| 1952 | Clarence J. Brown: 98,354 | ||
| 1954 | G. Louis Wren: 35,504 | Clarence J. Brown: 62,821 | |
| 1956 | Joseph A. Sullivan: 47,220 | Clarence J. Brown: 91,439 | |
| 1958 | Joseph A. Sullivan: 48,994 | Clarence J. Brown: 75,085 | |
| 1960 | Joseph A. Sullivan: 55,451 | Clarence J. Brown: 105,026 | |
| 1962 | Robert A. Riley: 39,908 | Clarence J. Brown: 83,680 | |
| 1964 | Jerry R. Graham: 70,857 | Bud Brown*: 93,022 | |
| 1966 | Bud Brown: 81,225 | ||
| 1968 | Robert E. Cecile: 55,386 | Bud Brown: 97,581 | |
| 1970 | Joseph D. Lewis: 37,294 | Bud Brown: 84,448 | |
| 1972 | Bud Brown: 112,350 | Dorothy Franke: 40,945 | |
| 1974 | Patrick L. Nelson: 34,828 | Bud Brown: 73,503 | Dorothy Franke: 13,088 |
| 1976 | Dorothy Franke: 54,755 | Bud Brown: 101,027 | |
| 1978 | Bud Brown: 92,507 | ||
| 1980 | Donald Hollister: 38,952 | Bud Brown: 124,137 | |
| 1982 | Roger D. Tackett: 65,543 | Mike DeWine: 87,842 | John B. Winer (L): 2,761 |
| 1984 | Donald E. Scott: 40,621 | Mike DeWine: 147,885 | Others: 4,352 |
| 1986 | Mike DeWine: 119,238 | ||
| 1988 | Jack Schira: 50,423 | Mike DeWine: 142,597 | |
| 1990 | Jack Schira: 59,349 | Dave Hobson: 97,123 | |
| 1992 | Clifford S. Heskett: 66,237 | Dave Hobson: 164,195 | |
| 1994 | Dave Hobson: 140,124 | ||
| 1996 | Richard K. Blain: 61,419 | Dave Hobson: 158,087 | Dawn Marie Johnson (N): 13,478 |
| 1998 | Donald E. Minor Jr.: 49,780 | Dave Hobson: 120,765 | James A. Schrader (L): 9,146 |
| 2000 | Donald E. Minor Jr.: 60,755 | Dave Hobson: 163,646 | John Mitchel: 13,983 Jack D. Null (L): 3,802 |
| 2002 | Kara Anastasio: 45,568 | Dave Hobson: 113,252 | Frank Doden (G): 8,812 |
| 2004 | Kara Anastasio: 97,972 | Dave Hobson: 182,621 | |
| 2006 | William R. Conner: 85,202 | Dave Hobson: 133,112 | |
| 2008 | Sharen Neuhardt: 113,099 | Steve Austria: 159,265 | |
| 2010 | William R. Conner: 70,400 | Steve Austria: 135,721 | John Anderson (L): 9,381 David Easton (C): 2,811 |
| 2012[4] | Joyce Healy-Abrams: 137,708 | Bob Gibbs: 178,104 | |
| 2014[5] | Bob Gibbs: 143,959 | ||
| 2016[6] | Roy Rich: 89,638 | Bob Gibbs: 198,221 | Dan Phillip: 21,694 |
| 2018[7] | Ken Harbaugh: 107,536 | Bob Gibbs: 153,117 | |
| 2020 | Quentin Potter: 102,271 | Bob Gibbs: 236,607 | Brandon Lape (L): 11,671 |
| 2022 | Matthew Diemer: 135,485 | Max Miller: 168,002 | Others: 86 |
Historical district boundaries
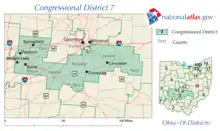
2003–2013
.tif.png.webp)
2013–2023
References
- "My Congressional District".
- "My Congressional District".
- "2022 Cook PVI: District Map and List". Cook Political Report. Retrieved January 10, 2023.
- "2012 Election Results". Ohio Secretary of State.
- "2014 Elections Results - Ohio Secretary of State". www.sos.state.oh.us. Retrieved October 7, 2020.
- "2016 Official Elections Results - Ohio Secretary of State". www.sos.state.oh.us. Retrieved October 7, 2020.
- "2018 Official Elections Results - Ohio Secretary of State". www.sos.state.oh.us. Retrieved October 7, 2020.
- Martis, Kenneth C. (1989). The Historical Atlas of Political Parties in the United States Congress. New York: Macmillan Publishing Company.
- Martis, Kenneth C. (1982). The Historical Atlas of United States Congressional Districts. New York: Macmillan Publishing Company.
- Congressional Biographical Directory of the United States 1774–present
This article is issued from Wikipedia. The text is licensed under Creative Commons - Attribution - Sharealike. Additional terms may apply for the media files.
.svg.png.webp)

.jpg.webp)
.png.webp)


.png.webp)




.jpg.webp)
