New Mexico's at-large congressional district
From statehood in 1912 to 1969, New Mexico did not use congressional districts for its representatives to the United States House of Representatives. Instead, it elected its representatives statewide at-large.
| New Mexico's at-largeth congressional district | |
|---|---|
| Obsolete district | |
| Created | 1912 |
| Eliminated | 1969 |
| Years active | 1912–1969 |
List of members representing the district
Elections
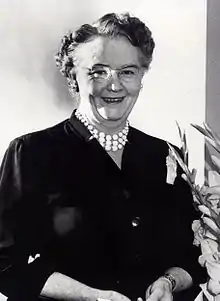
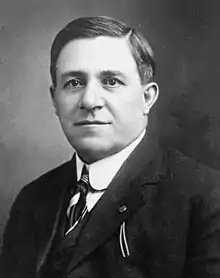
Republicans held onto the seat in 1920 by nominating Néstor Montoya, the county clerk of Bernalillo County and former Speaker of the New Mexico Territorial Legislature. Montoya won with a combination of Hispanic voters and coat-tails from the election of President Warren Harding. Republicans did not renominate him in 1922, choosing instead suffragist Adelina Otero-Warren, the niece of former territorial Governor, Miguel Otero, and the first woman to run for statewide office in New Mexico. Otero-Warren was defeated by Democrat John Morrow, an educator and lawyer from northeast New Mexico. Morrow would win consecutive re-elections in 1924 and 1926, but lost re-election in 1928 to Albert G. Simms, an Albuquerque businessman, on the coat-tails of the election of President Herbert Hoover.
| Party | Candidate | Votes | % | |
|---|---|---|---|---|
| Republican | Néstor Montoya | 54,672 | 51.88 | |
| Democratic | Antonio Lucero | 49,426 | 46.9 | |
| Farmer–Labor | A.J. McDonald | 1,290 | 1.22 | |
| Majority | 5,246 | 4.98 | ||
| Turnout | 105,388 | |||
| Republican gain from Democratic | ||||
| Party | Candidate | Votes | % | ±% | |
|---|---|---|---|---|---|
| Democratic | John Morrow | 59,254 | 54.42 | +7.25% | |
| Republican | Adelina Otero-Warren | 49,635 | 45.58 | -6.3% | |
| Majority | 9,619 | 8.83 | +3.85% | ||
| Turnout | 108,889 | ||||
| Democratic gain from Republican | Swing | ||||
| Party | Candidate | Votes | % | ±% | |
|---|---|---|---|---|---|
| Democratic | John Morrow | 57,802 | 51.76 | -2.66% | |
| Republican | J. Felipe Hubbell | 53,860 | 48.24 | +2.66% | |
| Majority | 3,942 | 3.53 | -5.30% | ||
| Turnout | 111,662 | ||||
| Democratic hold | Swing | ||||
| Party | Candidate | Votes | % | ±% | |
|---|---|---|---|---|---|
| Democratic | John Morrow | 55,433 | 51.42 | -0.34% | |
| Republican | Juan A. A. Sedillo | 52,075 | 48.31 | +0.07% | |
| Socialist | E. E. Denniston | 287 | 0.27 | +0.27% | |
| Majority | 3,358 | 3.12 | -0.41% | ||
| Turnout | 107,795 | ||||
| Democratic hold | Swing | ||||
| Party | Candidate | Votes | % | ±% | |
|---|---|---|---|---|---|
| Republican | Albert G. Simms | 61,208 | 52.2 | +3.89% | |
| Democratic | John Morrow | 56,048 | 47.8 | -3.62% | |
| Majority | 5,160 | 4.4 | +1.28% | ||
| Turnout | 117,256 | ||||
| Republican gain from Democratic | Swing | ||||
| Party | Candidate | Votes | % | ±% | |
|---|---|---|---|---|---|
| Democratic | Dennis Chavez | 65,194 | 57.1 | +9.3% | |
| Republican | Albert G. Simms | 48,699 | 42.65 | -9.55% | |
| Socialist | John Whitley | 299 | 0.26 | +0.26% | |
| Majority | 16,495 | 14.45 | +10.05% | ||
| Turnout | 114,192 | ||||
| Democratic gain from Republican | Swing | ||||
| Party | Candidate | Votes | % | ±% | |
|---|---|---|---|---|---|
| Democratic | Dennis Chavez | 94,764 | 63.36 | +6.26% | |
| Republican | Jose E. Armijo | 52,905 | 35.37 | -7.28% | |
| Socialist | N. S. Sweeney | 1,349 | 0.9 | +0.64% | |
| Liberty | L. E. Lake | 418 | 0.28 | +0.28% | |
| Communist | E. T. Howell | 132 | 0.09 | +0.09% | |
| Majority | 41,859 | 27.99 | +13.54% | ||
| Turnout | 149,568 | ||||
| Democratic hold | Swing | ||||
| Party | Candidate | Votes | % | ±% | |
|---|---|---|---|---|---|
| Democratic | John J. Dempsey | 76,833 | 51.82 | -11.54% | |
| Republican | Maurecio F. Miera | 70,659 | 47.66 | +12.29% | |
| Socialist | Frank Edwards | 643 | 0.43 | -0.47% | |
| Communist | H. Turnbaugh | 133 | 0.09 | +0.00% | |
| Majority | 6,174 | 4.16 | -23.83% | ||
| Turnout | 148,268 | ||||
| Democratic hold | Swing | ||||
| Party | Candidate | Votes | % | ±% | |
|---|---|---|---|---|---|
| Democratic | John J. Dempsey | 105,937 | 62.92 | +11.10% | |
| Republican | M. Ralph Brown | 62,375 | 37.05 | -10.61% | |
| Farmer–Labor | Albert Ortiz | 61 | 0.03 | +0.03% | |
| Majority | 43,562 | 25.87 | +21.71% | ||
| Turnout | 168,373 | ||||
| Democratic hold | Swing | ||||
| Party | Candidate | Votes | % | ±% | |
|---|---|---|---|---|---|
| Democratic | John J. Dempsey | 90,608 | 58.4 | -4.52% | |
| Republican | Peace C. Rodney | 64,281 | 41.43 | +4.38% | |
| Independent | E. W. Fawkes | 268 | 0.17 | +0.17% | |
| Majority | 26,327 | 16.97 | -8.9% | ||
| Turnout | 155,157 | ||||
| Democratic hold | Swing | ||||
References
- Martis, Kenneth C. (1989). The Historical Atlas of Political Parties in the United States Congress. New York: Macmillan Publishing Company.
- Martis, Kenneth C. (1982). The Historical Atlas of United States Congressional Districts. New York: Macmillan Publishing Company.
- Congressional Biographical Directory of the United States 1774–present
.jpg.webp)

_circa_1917.jpg.webp)
