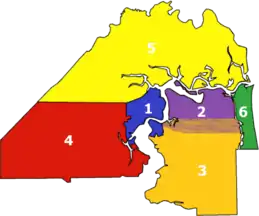
Mayport (Jacksonville)
Mayport is a small community located between Naval Station Mayport and the St. Johns River in Jacksonville, Florida.[1] It is part of the Jacksonville Beaches communities. The only public road to Mayport is State Road A1A, which crosses the St. Johns River Ferry to Fort George Island. On June 3, 1909, through action of the state legislature, Mayport was incorporated as a city.[2]
Climate
According to the Köppen Climate Classification system, Mayport has a humid subtropical climate, abbreviated "Cfa" on climate maps. The hottest temperature recorded in Mayport was 103 °F (39.4 °C) on July 19–20, 1986, June 20, 1990, July 31, 1990, and June 23, 2022, while the coldest temperature recorded was 8 °F (−13.3 °C) on January 21, 1985.[3]
| Climate data for Mayport, Florida, 1991–2020 normals, extremes 1959–present | |||||||||||||
|---|---|---|---|---|---|---|---|---|---|---|---|---|---|
| Month | Jan | Feb | Mar | Apr | May | Jun | Jul | Aug | Sep | Oct | Nov | Dec | Year |
| Record high °F (°C) | 87 (31) |
90 (32) |
91 (33) |
96 (36) |
98 (37) |
103 (39) |
103 (39) |
101 (38) |
100 (38) |
96 (36) |
89 (32) |
87 (31) |
103 (39) |
| Mean maximum °F (°C) | 79.7 (26.5) |
82.0 (27.8) |
85.5 (29.7) |
88.5 (31.4) |
92.4 (33.6) |
95.7 (35.4) |
97.1 (36.2) |
95.7 (35.4) |
93.1 (33.9) |
88.3 (31.3) |
83.8 (28.8) |
80.9 (27.2) |
97.7 (36.5) |
| Average high °F (°C) | 63.9 (17.7) |
66.5 (19.2) |
71.4 (21.9) |
77.1 (25.1) |
83.3 (28.5) |
87.9 (31.1) |
90.4 (32.4) |
89.2 (31.8) |
85.9 (29.9) |
79.8 (26.6) |
72.4 (22.4) |
66.2 (19.0) |
77.8 (25.5) |
| Daily mean °F (°C) | 55.2 (12.9) |
58.0 (14.4) |
62.8 (17.1) |
68.7 (20.4) |
75.4 (24.1) |
80.4 (26.9) |
82.5 (28.1) |
82.2 (27.9) |
79.6 (26.4) |
73.1 (22.8) |
64.5 (18.1) |
58.1 (14.5) |
70.0 (21.1) |
| Average low °F (°C) | 46.5 (8.1) |
49.4 (9.7) |
54.2 (12.3) |
60.4 (15.8) |
67.5 (19.7) |
72.9 (22.7) |
74.7 (23.7) |
75.2 (24.0) |
73.4 (23.0) |
66.4 (19.1) |
56.5 (13.6) |
50.1 (10.1) |
62.3 (16.8) |
| Mean minimum °F (°C) | 30.9 (−0.6) |
34.3 (1.3) |
39.3 (4.1) |
47.6 (8.7) |
57.7 (14.3) |
68.0 (20.0) |
71.3 (21.8) |
71.9 (22.2) |
66.6 (19.2) |
52.4 (11.3) |
41.4 (5.2) |
35.9 (2.2) |
28.9 (−1.7) |
| Record low °F (°C) | 8 (−13) |
21 (−6) |
28 (−2) |
37 (3) |
47 (8) |
57 (14) |
67 (19) |
68 (20) |
57 (14) |
41 (5) |
27 (−3) |
15 (−9) |
8 (−13) |
| Average precipitation inches (mm) | 2.93 (74) |
2.58 (66) |
3.06 (78) |
2.48 (63) |
3.03 (77) |
6.61 (168) |
5.43 (138) |
5.96 (151) |
6.44 (164) |
4.98 (126) |
2.28 (58) |
2.76 (70) |
48.54 (1,233) |
| Average precipitation days (≥ 0.01 in) | 9.3 | 8.7 | 9.0 | 7.2 | 7.4 | 12.8 | 12.9 | 14.5 | 11.7 | 9.5 | 8.5 | 9.2 | 120.7 |
| Source 1: NOAA[4] | |||||||||||||
| Source 2: XMACIS2[3] | |||||||||||||
References
- Wood, Wayne (1992). Jacksonville's Architectural Heritage. University Press of Florida. pp. 323–325. ISBN 0-8130-0953-7.
- Godard Design Associates (June 30, 2000). "Historic Resources Survey Mayport Village, Florida" (PDF).
- "xmACIS2". National Oceanic and Atmospheric Administration. Retrieved February 28, 2023.
- "U.S. Climate Normals Quick Access – Station: Mayport Pilot STN, FL". National Oceanic and Atmospheric Administration. Retrieved February 28, 2023.
External links
Wikivoyage has a travel guide for Mayport.
 Geographic data related to Mayport (Jacksonville) at OpenStreetMap
This article is issued from Wikipedia. The text is licensed under Creative Commons - Attribution - Sharealike. Additional terms may apply for the media files.

