Radar geo-warping
Radar geo-warping is the adjustment of geo-referenced radar images and video data to be consistent with a geographical projection. This image warping avoids any restrictions when displaying it together with video from multiple radar sources or with other geographical data including scanned maps and satellite images which may be provided in a particular projection. There are many areas where geo warping has unique benefits:
- Single radar video signal displayed together with maps of different geographical projections. E.g.
- Multiple radar video signals displayed simultaneously:
- Having the computing power to do so on one computer.
- Adapting the projection of all radar signals allowing the geographically correct display and accurate superimposition of those videos.
- Slant range correction: a modern 3D radar system can measure the height of a target and hence it is possible to correct the radar video by the real corrected range of the target. Slant Range Correction also allows to compensate the radar tower height e.g. for maritime surveillance radars.
Introduction
Radar video presents the echoes of electromagnetic waves a radar system has emitted and received as reflections afterwards. These echoes are typically presented on a computer screen with a color-coding scheme depicting the reflection strength. Two problems have to be solved during such a visualization process. The first problem arises from the fact that typically the radar antenna turns around its position and measures the reflection echo distances from its position in one direction. This effectively means that the radar video data are present in polar coordinates. In older systems the polar oriented picture has been displayed in so called plan position indicators (PPI). The PPI-scope uses a radial sweep pivoting about the center of the presentation. This results in a map-like picture of the area covered by the radar beam. A long-persistence screen is used so that the display remains visible until the sweep passes again.
Bearing to the target is indicated by the target's angular position in relation to an imaginary line extending vertically from the sweep origin to the top of the scope. The top of the scope is either true north (when the indicator is operated in the true bearing mode) or ship's heading (when the indicator is operated in the relative bearing mode).

For visualization on a modern computer screen the polar coordinates have to be converted into Cartesian coordinates. This process called radar scan conversion is presented with more detail in the next section. The second problem to solve arises from the fact that a radar system is placed in the real world and measures real world echo positions. These echoes have to be displayed together with other real world data like object positions, vector maps and satellite images in a consistent way. All this information refers to the curved earth surface but is displayed on a flat computer display. Building a link from real world earth positions to display pixels is commonly called geographical referencing or in short geo-referencing.
Part of the geo-referencing process is to map the 3D earth surface onto a 2D display. This process of a geographical projection can be performed in many ways, but different data sources have their own 'natural' projection. E.g. Cartesian radar video data from a radar source on the earth surface are geo-referenced by a so-called radar projection. When using this radar projection the Cartesian radar video pixels can directly displayed on a computer screen (only being linearly transformed according to the current position on the screen and e.g. the current zoom level). A problem now arises if e.g. also a satellite map shall be shown together with the radar video data. The 'natural' geographical projection of a satellite image would be a satellite projection which depends on the satellite orbit, position and further parameters. Now either the satellite image has to be reprojected to a radar projection or the radar video has to use the satellite projection. This geographical re-projection is also called geographical warping or Geo Warping where each image pixel has to be transformed from one projection into another. This article describes in further detail the Geo Warping of radar video images in real time. It will also show that radar video Geo Warping is done most efficiently when it is integrated with the radar scan conversion process.
Radar-scan conversion
This section describes the principles of the radar-scan conversion (RSC) process.
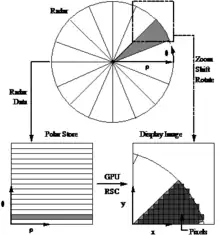
The radar supplies its measured data in polar coordinates (ρ,θ) directly from the rotating antenna. ρ defines the target/echo distance and θ the target angle in polar world coordinates. These data are measured, digitized and stored in a polar coordinate polar store or polar pixmap. The main RSC task is to convert these data to Cartesian (x, y) display coordinates, creating the necessary display pixels. The RSC process is influenced by the current zoom, shift and rotation settings defining which part of the 'world' shall be visible in the display image. As detailed later the RSC process also takes the currently used geographical projection into account when the radar video images are Geo Warped.
The OpenGL RSC is implemented using a reverse scan conversion approach which calculates for every image pixel the most appropriate radar amplitude value in the polar store. This approach generates an optimal image without any artifacts known from forward spoke fill algorithms. By applying bi-linear filtering between adjacent pixels in the polar store during the conversion process the OpenGL RSC finally achieves a very high visual quality radar display image for every zoom level, creating smooth images of the radar echoes.
Radar projection
This section illustrates how radar video data are geo referenced and displayed on a computer screen.

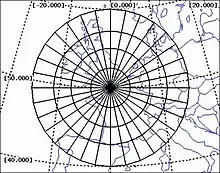
The radar sensor is positioned on the earth surface with a height h above the ground. It measures the direct distance d to the target (and not e.g. the distance the target is away from the radar if one would move on the earth surface). This distance is then used in the display plane after adjustment to the current display zoom level by the radar scan converter (RSC). Now it has to be clarified how the radar video data is geo referenced. This basically means, that if we want to display a geographical real world object (like e.g. a light house) which is at the same real world position as the radar target, that it also shall appear at the same position in the display plane. This is realized by calculating the distance from the radar sensor to the respective real world object and use that distance in the display plane. The position of the real world object is typically given in geographical coordinates (latitude, longitude and height above the earth surface). In other words, using a radar projection with geographical data is done by simulating a radar measurement process with the real world objects and use the resulting range and azimuth in the display plane.
The second picture to the right shows an example radar projection with the center of projection (COP) at latitude 50.0° and longitude 0.0° which is also the radar position. The dashed lines are the equal-latitude and equal-longitude lines on top of the background map. The solid lines show equal-range and equal-azimuth with the respect to the radar position. It is a feature of the radar projection that equal-range lines are circles and equal-azimuth lines are straight lines. This is necessary to display radar video consistently with other map data when using a radar projection where the projection center has to be the radar position.
Geo Warping process
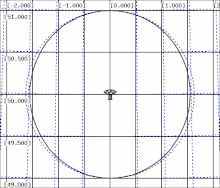
This section explains the actual geo warping or re-projection process when applied to radar video in real time. Assume we want to display radar video on top of a satellite image. As an example we use the CIB projection which is used to display satellite data in CIB (Controlled Image Base) format.
The Figure Geo Warping Radar to CIB Projection shows dashed the maximal range circle for a range of 111 km or 60 miles using the radar projection. Such a range is typical for long range coastal surveillance radars. As stated in the last section this is a perfect circle also on the computer screen. The solid line ellipse shows the same range circle for the CIB projection.
Typically the errors occurring without Geo Warping are smallest near the radar position if at least the projection center (COP) coincides with the radar position, as realized in our example. Otherwise the error distribution depends both on the used projection and also on the projection parameters. Thus, in our case the errors are most significant near the maximum radar range. The CIB projection error corrected in east–west direction at half the radar range is 2.6 km and is 5.3 km at the full radar range of 111 km. An error of 5.3 km is quite significant compared to a typical radial radar measurement resolution of 15 m.
The Figure Coordinate re-projection explains how the radar coordinates have to be transformed to match the CIB projection coordinates. The radar world coordinates correspond to the Cartesian version of the data measured by the radar sensor. Using an inverse radar projection these coordinates are converted into geographic coordinates which represent the radar data posi-tions on the earth surface. These coordinates are then finally projected by the CIB (or any other) projection for displaying on the computer screen.
A problem which arises is that geo warping all measured radar video pixels is far too computing resource consuming as to be performed in real time. A possible solution is to use lookup tables for all points on the screen, but the lookup table re-computation after e.g. a display zoom operation still causes a noticeable delay for radar video visualization.
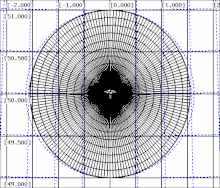
The Figure Geo warping grid depicts the solution to the problem. The circular radar coverage area is divided into a circular grid. Only the corner points of the grid are geo warped which drastically reduces the computation time. Coordinates within a grid tile are computed by a weighted bilinear interpolation of the grid corner points. As geographical projections are typically non-linear functions this introduces a certain error for the radar video display position. Keeping this error sufficiently below the radar measurement resolution makes sure that this is no restriction for the radar video display quality. The grid tile size has to be computed once for a radar position and a given projection. Thus, the grid is typically computed once for a static radar and only more often for moving radars such as on ships.
The OpenGL radar-scan converter does its scan conversion computations on the graphics processing unit to achieve high performance and visual quality. The bi-linear coordinate interpolation mentioned above is done in dedicated hardware on the GPU and therefore causes no overhead for the scan converter.
Example
This example demonstrates how geo warping helps to consistently display multiple radar videos.
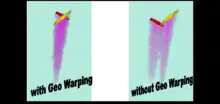
This figure shows the visual effects on the right side without geo warping that targets seen by two radars cannot be correctly displayed and it is unclear where the target is actually positioned. The red and yellow target echoes are seen be radars which are about 50 km away. The radars are also about 50 km away from each other. The semi-transparent pink color depicts the track history.
In this scenario even a radar projection is used but of course the radar projection center (COP) can be only at the position of one of the radars. Even larger inconsistencies can arise if a projection different from a radar projection is used. The geo warped view on the left side shows the consistently displayed radar echoes where both radar echoes are exactly at the real target's position.