Elland (UK Parliament constituency)
| Elland | |
|---|---|
| Former County constituency for the House of Commons | |
| County | West Riding of Yorkshire |
| Major settlements | Elland, Brighouse |
| 1885–1950 | |
| Created from | Northern West Riding of Yorkshire |
| Replaced by | Brighouse & Spenborough, Bradford South, Halifax and Sowerby |
Elland was a parliamentary constituency in the West Riding of Yorkshire that existed between 1885 and 1950. It elected one Member of Parliament (MP) to the House of Commons, by the first-past-the-post voting system.
Situated between Bradford in the North, Halifax in the West, and Huddersfield to the south, it included the mining town of Brighouse and the wool centre of Elland. With a sizeable Nonconformist population (estimated at 15 per cent in 1922), it was natural Liberal territory, and was a fairly safe Liberal and later Labour seat, falling to the Conservatives only in the 'khaki election' of 1918 and the Labour collapse of 1931. In the 1918 redistribution it lost some territory and it was abolished in 1950. A sizeable part of the area was transferred to the new Brighouse and Spenborough seat.
Boundaries
1885–1918:
1918–1950: The Municipal Borough of Brighouse, the Urban Districts of Clayton, Elland, Greetland, Hipperholme, Queensberry, Shelf, Southowram, and Stainland, and the Rural District of Halifax except the parish of Norland.
Members of Parliament
Elections
Elections in the 1880s
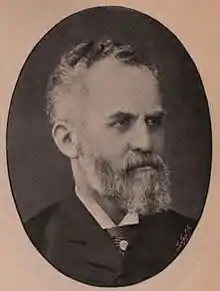
| Party | Candidate | Votes | % | ±% | |
|---|---|---|---|---|---|
| Liberal | Thomas Wayman | 6,516 | 65.3 | ||
| Conservative | Carne Rasch | 3,457 | 34.7 | ||
| Majority | 3,059 | 30.6 | |||
| Turnout | 9,973 | 84.2 | |||
| Registered electors | 11,851 | ||||
| Liberal win (new seat) | |||||
| Party | Candidate | Votes | % | ±% | |
|---|---|---|---|---|---|
| Liberal | Thomas Wayman | Unopposed | |||
| Liberal hold | |||||
Elections in the 1890s
| Party | Candidate | Votes | % | ±% | |
|---|---|---|---|---|---|
| Liberal | Thomas Wayman | 5,497 | 59.9 | N/A | |
| Conservative | James Hope | 3,676 | 40.1 | New | |
| Majority | 1,821 | 19.8 | N/A | ||
| Turnout | 9,173 | 68.3 | N/A | ||
| Registered electors | 13,437 | ||||
| Liberal hold | Swing | N/A | |||
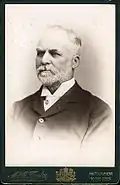
| Party | Candidate | Votes | % | ±% | |
|---|---|---|---|---|---|
| Liberal | Thomas Wayman | 5,387 | 51.5 | -8.4 | |
| Conservative | Arthur Travis Clay | 5,081 | 48.5 | +8.4 | |
| Majority | 306 | 3.0 | -16.8 | ||
| Turnout | 10,468 | 83.6 | +15.3 | ||
| Registered electors | 12,526 | ||||
| Liberal hold | Swing | -8.4 | |||
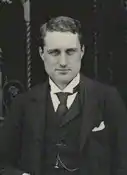
| Party | Candidate | Votes | % | ±% | |
|---|---|---|---|---|---|
| Liberal | Charles Trevelyan | 6,041 | 54.4 | +2.9 | |
| Conservative | Philip Foster | 5,057 | 45.6 | -2.9 | |
| Majority | 984 | 8.8 | +5.8 | ||
| Turnout | 11,098 | 85.9 | +2.3 | ||
| Registered electors | 12,926 | ||||
| Liberal hold | Swing | +2.9 | |||
Elections in the 1900s
| Party | Candidate | Votes | % | ±% | |
|---|---|---|---|---|---|
| Liberal | Charles Trevelyan | 6,154 | 57.7 | +6.2 | |
| Conservative | Edward Coates | 4,512 | 42.3 | −6.2 | |
| Majority | 1,642 | 15.4 | +12.4 | ||
| Turnout | 10,666 | 81.1 | −2.5 | ||
| Registered electors | 13,146 | ||||
| Liberal hold | Swing | +6.2 | |||
| Party | Candidate | Votes | % | ±% | |
|---|---|---|---|---|---|
| Liberal | Charles Trevelyan | 7,609 | 65.8 | +8.1 | |
| Conservative | Thomas Brooke-Hitching | 3,962 | 34.2 | −8.1 | |
| Majority | 3,647 | 31.6 | +16.2 | ||
| Turnout | 11,571 | 83.7 | +2.6 | ||
| Registered electors | 13,828 | ||||
| Liberal hold | Swing | +8.1 | |||
Elections in the 1910s
| Party | Candidate | Votes | % | ±% | |
|---|---|---|---|---|---|
| Liberal | Charles Trevelyan | 7,469 | 61.4 | -4.4 | |
| Conservative | George Taylor Ramsden | 4,686 | 38.6 | +4.4 | |
| Majority | 2,783 | 22.8 | -8.8 | ||
| Turnout | 12,155 | 87.1 | +3.4 | ||
| Liberal hold | Swing | -4.4 | |||
| Party | Candidate | Votes | % | ±% | |
|---|---|---|---|---|---|
| Liberal | Charles Trevelyan | 6,613 | 59.2 | -2.2 | |
| Conservative | George Taylor Ramsden | 4,549 | 40.8 | +2.2 | |
| Majority | 2,064 | 18.4 | -4.4 | ||
| Turnout | 11,162 | 80.0 | -7.1 | ||
| Liberal hold | Swing | -2.2 | |||
General Election 1914–15:
Another General Election was required to take place before the end of 1915. The political parties had been making preparations for an election to take place and by the July 1914, the following candidates had been selected;
- Liberal: Charles Trevelyan
- Unionist: George Taylor Ramsden
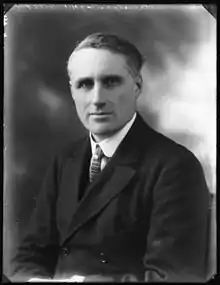
| Party | Candidate | Votes | % | ±% | |
|---|---|---|---|---|---|
| C | Unionist | George Taylor Ramsden | 8,917 | 38.4 | −2.4 |
| Liberal | Harry Dawson | 7,028 | 30.4 | −28.8 | |
| Labour | Dennis Hardaker | 5,923 | 25.6 | New | |
| Independent Labour | Charles Trevelyan | 1,286 | 5.6 | New | |
| Majority | 1,889 | 8.0 | N/A | ||
| Turnout | 23,154 | 67.0 | −13.0 | ||
| Registered electors | 34,584 | ||||
| Unionist gain from Liberal | Swing | +13.2 | |||
| C indicates candidate endorsed by the coalition government. | |||||
Elections in the 1920s
| Party | Candidate | Votes | % | ±% | |
|---|---|---|---|---|---|
| Labour | William C. Robinson | 10,590 | 36.8 | +11.2 | |
| National Liberal | Robert Kay | 10,160 | 35.3 | +4.9 | |
| Unionist | George Taylor Ramsden | 8,039 | 27.9 | −10.5 | |
| Majority | 430 | 1.5 | n/a | ||
| Turnout | 28,789 | 81.9 | +14.9 | ||
| Registered electors | 35,145 | ||||
| Labour gain from Unionist | Swing | +3.2 | |||
| Party | Candidate | Votes | % | ±% | |
|---|---|---|---|---|---|
| Liberal | Robert Kay | 12,476 | 50.9 | +15.6 | |
| Labour | William C. Robinson | 12,031 | 49.1 | +12.3 | |
| Majority | 445 | 1.8 | N/A | ||
| Turnout | 24,507 | 70.0 | −11.9 | ||
| Registered electors | 35,008 | ||||
| Liberal gain from Labour | Swing | +1.7 | |||
| Party | Candidate | Votes | % | ±% | |
|---|---|---|---|---|---|
| Labour | William C. Robinson | 11,690 | 39.5 | −9.6 | |
| Unionist | Albert Braithwaite | 11,202 | 37.8 | New | |
| Liberal | Robert Kay | 6,713 | 22.7 | −28.2 | |
| Majority | 488 | 1.7 | N/A | ||
| Turnout | 29,605 | 84.1 | +14.1 | ||
| Registered electors | 35,214 | ||||
| Labour gain from Liberal | Swing | +9.3 | |||
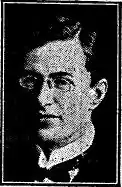
| Party | Candidate | Votes | % | ±% | |
|---|---|---|---|---|---|
| Labour | Charles Buxton | 17,012 | 43.7 | +4.2 | |
| Unionist | Sam Howard | 11,150 | 28.7 | −9.1 | |
| Liberal | William Haughton Sessions | 10,734 | 27.6 | +4.9 | |
| Majority | 5,862 | 15.0 | +13.3 | ||
| Turnout | 38,896 | 83.6 | −0.5 | ||
| Registered electors | 46,499 | ||||
| Labour hold | Swing | +6.7 | |||
Elections in the 1930s
| Party | Candidate | Votes | % | ±% | |
|---|---|---|---|---|---|
| Conservative | Thomas Levy | 25,378 | 65.2 | +36.5 | |
| Labour | Charles Buxton | 13,563 | 34.8 | -8.9 | |
| Majority | 11,815 | 30.4 | N/A | ||
| Turnout | 38,941 | 82.5 | -1.1 | ||
| Conservative gain from Labour | Swing | +22.7 | |||
| Party | Candidate | Votes | % | ±% | |
|---|---|---|---|---|---|
| Conservative | Thomas Levy | 19,498 | 52.2 | -13.0 | |
| Labour | Charles Buxton | 17,856 | 47.8 | +13.0 | |
| Majority | 1,642 | 4.4 | -26.0 | ||
| Turnout | 37,454 | 77.2 | -5.3 | ||
| Conservative hold | Swing | -13.0 | |||
Elections in the 1940s
General Election 1939–40: Another General Election was required to take place before the end of 1940. The political parties had been making preparations for an election to take place from 1939 and by the end of this year, the following candidates had been selected:
- Conservative: Thomas Levy
- Labour: Gilbert Mitchison
| Party | Candidate | Votes | % | ±% | |
|---|---|---|---|---|---|
| Labour | Frederick Cobb | 19,632 | 50.3 | +2.5 | |
| Conservative | Thomas Levy | 11,570 | 29.7 | -22.5 | |
| Liberal | John Wilson | 7,805 | 20.0 | New | |
| Majority | 8,062 | 20.6 | N/A | ||
| Turnout | 39,007 | 79.9 | +2.7 | ||
| Labour gain from Conservative | Swing | +12.5 | |||
References
- British Parliamentary Election Results 1885-1918, FWS Craig
- British Parliamentary Election Results 1918-1949, FWS Craig
- Leigh Rayment's Historical List of MPs – Constituencies beginning with "E" (part 2)
- Michael Kinnear, The British Voter: An Atlas and Survey Since 1885 (London: Batsford Academic and Educational Ltd., 1981, 2nd ed.)