Electoral history of Jerry Brown
The electoral history of Jerry Brown, California Governor (1975–1983, 2011–2019), Secretary of State (1971–1975), Attorney General (2007–2011); and Mayor of Oakland (1999–2007).

Governor Jerry Brown
Secretary of state
| Primary election | ||||
|---|---|---|---|---|
| Party | Candidate | Votes | % | |
| Democratic | Jerry Brown | 1,632,886 | 67.70 | |
| Democratic | Hugh M. Burns | 591,320 | 24.52 | |
| Democratic | Jimmy Campbell | 187,899 | 7.79 | |
| Total votes | 2,412,105 | 100% | ||
| General election | ||||
| Democratic | Jerry Brown | 3,234,788 | 50.41 | |
| Republican | James L. Flournoy | 2,926,613 | 45.61 | |
| American Independent | Thomas M. Goodloe, Jr. | 144,838 | 2.26 | |
| Peace and Freedom | Israel Feuer | 110,184 | 1.72 | |
| Total votes | 6,416,423 | 100% | ||
Governor
1974
| Primary election | ||||
|---|---|---|---|---|
| Party | Candidate | Votes | % | |
| Democratic | Jerry Brown | 1,085,752 | 37.75 | |
| Democratic | Joseph L. Alioto | 544,007 | 18.92 | |
| Democratic | Bob Moretti | 478,469 | 16.64 | |
| Democratic | William M. Roth | 293,686 | 10.21 | |
| Democratic | Jerome L. Waldie | 277,489 | 7.91 | |
| Democratic | Baxter Ward | 79,745 | 2.77 | |
| Democratic | Herbert Hafif | 77,505 | 2.70 | |
| Democratic | Alex D. Aloia | 18,400 | 0.64 | |
| Democratic | Conie R. Robertson | 13,493 | 0.47 | |
| Democratic | Robert H. Wagner | 8,955 | 0.31 | |
| Democratic | Jim Wedworth | 7,973 | 0.28 | |
| Democratic | Joe Brouillette | 7,906 | 0.28 | |
| Democratic | John Hancock Abbott | 6,921 | 0.24 | |
| Democratic | Joseph S. Ramos | 6,721 | 0.23 | |
| Democratic | Eileen Anderson | 6,666 | 0.23 | |
| Democratic | Ray Chote | 6,113 | 0.21 | |
| Democratic | Chris Musun | 3,495 | 0.12 | |
| Democratic | Russ Priebe | 1,427 | 0.05 | |
| Write-in | 1,349 | 0.05 | ||
| Total votes | 2,926,072 | 100% | ||
| General election | ||||
| Democratic | Jerry Brown | 3,131,648 | 50.12 | |
| Republican | Houston I. Flournoy | 2,952,954 | 47.26 | |
| American Independent | Edmon V. Kaiser | 83,869 | 1.34 | |
| Peace and Freedom | Elizabeth Keathley | 75,004 | 1.20 | |
| Write-in | 4,595 | 0.07 | ||
| Total votes | 6,248,070 | 100% | ||
1978
| Primary election | ||||
|---|---|---|---|---|
| Party | Candidate | Votes | % | |
| Democratic | Jerry Brown (incumbent) | 2,567,067 | 77.53 | |
| Democratic | David Rock | 132,706 | 4.01 | |
| Democratic | John Hancock Abbott | 127,506 | 3.85 | |
| Democratic | George B. Roden | 125,790 | 3.80 | |
| Democratic | Jules Kimmett | 83,339 | 2.52 | |
| Democratic | Gene Atherton | 80,224 | 2.42 | |
| Democratic | Alex D. Aloia | 67,892 | 2.05 | |
| Democratic | Raymond V. Liebenberg | 65,219 | 1.97 | |
| Democratic | Lowell Barling | 60,997 | 1.84 | |
| Write-in | 178 | 0.01 | ||
| Total votes | 3,310,918 | 100% | ||
| General election | ||||
| Democratic | Jerry Brown (incumbent) | 3,878,812 | 56.03 | |
| Republican | Evelle J. Younger | 2,526,534 | 36.50 | |
| Libertarian | Ed Clark | 377,960 | 5.46 | |
| Peace and Freedom | Marilyn Seals | 70,864 | 1.02 | |
| American Independent | Theresa F. Dietrich | 67,103 | 0.97 | |
| Write-in | 1,040 | 0.02 | ||
| Total votes | 6,922,313 | 100% | ||
2010
| Primary election | ||||
|---|---|---|---|---|
| Party | Candidate | Votes | % | |
| Democratic | Jerry Brown | 2,021,189 | 84.38 | |
| Democratic | Richard Aguirre | 95,596 | 3.99 | |
| Democratic | Chuck Pineda, Jr. | 94,669 | 3.95 | |
| Democratic | Vibert Greene | 54,225 | 2.26 | |
| Democratic | Joe Symmon | 54,122 | 2.26 | |
| Democratic | Lowell Darling | 39,930 | 1.67 | |
| Democratic | Peter Schurman | 35,450 | 1.48 | |
| Write-in | 106 | 0.00 | ||
| Total votes | 2,395,287 | 100% | ||
| General election | ||||
| Democratic | Jerry Brown | 5,428,149 | 53.77 | |
| Republican | Meg Whitman | 4,127,391 | 40.89 | |
| American Independent | Chelene Nightingale | 166,312 | 1.65 | |
| Libertarian | Dale F. Ogden | 150,895 | 1.50 | |
| Green | Laura Wells | 129,224 | 1.28 | |
| Peace and Freedom | Carlos Alvarez | 92,851 | 0.92 | |
| Write-in | 363 | 0.00 | ||
| Total votes | 10,095,185 | 100% | ||
2014
| Primary election | ||||
|---|---|---|---|---|
| Party | Candidate | Votes | % | |
| Democratic | Jerry Brown (incumbent) | 2,354,769 | 54.35 | |
| Republican | Neel Kashkari | 839,767 | 19.38 | |
| Republican | Tim Donnelly | 643,236 | 14.85 | |
| Republican | Andrew Blount | 89,749 | 2.07 | |
| Republican | Glenn Champ | 76,066 | 1.76 | |
| Green | Luis J. Rodriguez | 66,872 | 1.54 | |
| Peace and Freedom | Cindy Sheehan | 52,707 | 1.22 | |
| Republican | Alma Marie Winston | 46,042 | 1.06 | |
| No party preference | Robert C. Newman II | 44,120 | 1.02 | |
| Democratic | Akinyemi Agbede | 37,024 | 0.85 | |
| Republican | Richard Aguirre | 35,125 | 0.81 | |
| No party preference | "Bo" Bogdan Ambrozewicz | 14,929 | 0.35 | |
| No party preference | Janel Hyeshia Buycks | 12,136 | 0.28 | |
| No party preference | Rakesh Kumar Christian | 11,142 | 0.26 | |
| Total votes | 4,247,618 | 100% | ||
| General election | ||||
| Democratic | Jerry Brown (incumbent) | 4,388,368 | 59.97 | |
| Republican | Neel Kashkari | 2,929,213 | 40.03 | |
| Total votes | 7,317,581 | 100% | ||
Democratic presidential nominee
1976

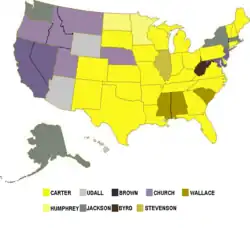
1976 Democratic presidential primary by state results
| Party | Candidate | Votes | % | |
|---|---|---|---|---|
| Democratic | Jimmy Carter | 6,235,609 | 39.19 | |
| Democratic | Jerry Brown | 2,449,374 | 15.39 | |
| Democratic | George Wallace | 1,955,388 | 12.29 | |
| Democratic | Morris K. Udall | 1,611,754 | 10.13 | |
| Democratic | Henry M. Jackson | 1,134,375 | 7.13 | |
| Democratic | Frank Church | 830,818 | 5.22 | |
| Democratic | Robert Byrd | 340,309 | 2.14 | |
| Democratic | Sargent Shriver | 304,399 | 1.91 | |
| Democratic | Unpledged delegates | 283,437 | 1.78 | |
| Democratic | Ellen McCormack | 238,027 | 1.50 | |
| Democratic | Fred R. Harris | 234,568 | 1.47 | |
| Democratic | Milton Shapp | 88,254 | 0.56 | |
| Democratic | Birch Bayh | 86,438 | 0.54 | |
| Democratic | Others | 118,627 | 0.75 | |
| Total votes | 15,911,377 | 100% | ||
| Party | Candidate | Votes | % | |
|---|---|---|---|---|
| Democratic | Jimmy Carter | 2,239 | 74.48 | |
| Democratic | Morris K. Udall | 330 | 10.98 | |
| Democratic | Jerry Brown | 301 | 10.01 | |
| Democratic | George Wallace | 57 | 1.90 | |
| Democratic | Ellen McCormack | 22 | 0.73 | |
| Democratic | Frank Church | 19 | 0.63 | |
| Democratic | Hubert Humphrey | 10 | 0.33 | |
| Democratic | Henry M. Jackson | 10 | 0.33 | |
| Democratic | Fred R. Harris | 9 | 0.30 | |
| Democratic | Milton Shapp | 2 | 0.07 | |
| Democratic | Robert Byrd | 1 | 0.03 | |
| Democratic | Cesar Chavez | 1 | 0.03 | |
| Democratic | Leon Jaworski | 1 | 0.03 | |
| Democratic | Barbara Jordan | 1 | 0.03 | |
| Democratic | Ted Kennedy | 1 | 0.03 | |
| Democratic | Jennings Randolph | 1 | 0.03 | |
| Democratic | Fred Stover | 1 | 0.03 | |
| Total votes | 3,006 | 100% | ||
1980

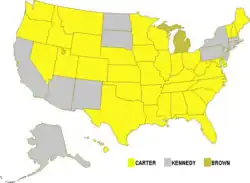
1980 Democratic presidential primaries by state results
| Party | Candidate | Votes | % | |
|---|---|---|---|---|
| Democratic | Jimmy Carter (incumbent) | 10,043,016 | 51.11 | |
| Democratic | Ted Kennedy | 7,381,693 | 37.57 | |
| Democratic | Unpledged delegates | 1,288,423 | 6.56 | |
| Democratic | Jerry Brown | 575,296 | 2.93 | |
| Democratic | Lyndon LaRouche | 177,784 | 0.91 | |
| Democratic | Richard B. Kay | 48,061 | 0.24 | |
| Democratic | Cliff Finch | 48,032 | 0.24 | |
| Democratic | Others | 87,153 | 0.44 | |
| Total votes | 19,649,458 | 100% | ||
| Party | Candidate | Votes | % | |
|---|---|---|---|---|
| Democratic | Jimmy Carter (incumbent) | 2,123 | 64.04 | |
| Democratic | Ted Kennedy | 1,151 | 34.72 | |
| Democratic | William Proxmire | 10 | 0.30 | |
| Democratic | Koryne Kaneski Horbal | 5 | 0.15 | |
| Democratic | Scott M. Matheson, Sr. | 5 | 0.15 | |
| Democratic | Ron Dellums | 3 | 0.09 | |
| Democratic | Robert Byrd | 2 | 0.06 | |
| Democratic | John Culver | 2 | 0.06 | |
| Democratic | Kent Hance | 2 | 0.06 | |
| Democratic | Jennings Randolph | 2 | 0.06 | |
| Democratic | Alice Tripp | 2 | 0.06 | |
| Democratic | Warren Spannaus | 2 | 0.06 | |
| Democratic | Jerry Brown | 1 | 0.03 | |
| Democratic | Dale Bumpers | 1 | 0.03 | |
| Democratic | Hugh L. Carey | 1 | 0.03 | |
| Democratic | Edmund S. Muskie | 1 | 0.03 | |
| Democratic | Thomas J. Steed | 1 | 0.03 | |
| Democratic | Walter Mondale | 1 | 0.03 | |
| Total votes | 3,315 | 100% | ||
1992

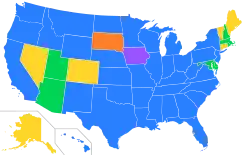
1992 Democratic presidential primaries by state results
| Party | Candidate | Votes | % | |
|---|---|---|---|---|
| Democratic | Bill Clinton | 10,482,411 | 51.98 | |
| Democratic | Jerry Brown | 4,071,232 | 20.19 | |
| Democratic | Paul Tsongas | 3,656,010 | 18.13 | |
| Democratic | Unpledged delegates | 750,873 | 3.72 | |
| Democratic | Bob Kerrey | 318,457 | 1.58 | |
| Democratic | Tom Harkin | 280,304 | 1.39 | |
| Democratic | Lyndon LaRouche, Jr. | 154,599 | 0.77 | |
| Democratic | Eugene McCarthy | 108,678 | 0.54 | |
| Democratic | Others | 342,605 | 1.70 | |
| Total votes | 20,165,169 | 100% | ||
| Party | Candidate | Votes | % | |
|---|---|---|---|---|
| Democratic | Bill Clinton | 3,372 | 80.27 | |
| Democratic | Jerry Brown | 596 | 14.19 | |
| Democratic | Paul Tsongas | 209 | 4.98 | |
| Democratic | Robert P. Casey | 10 | 0.24 | |
| Democratic | Patricia Schroeder | 8 | 0.19 | |
| Democratic | Larry Agran | 3 | 0.07 | |
| Democratic | Ron Daniels | 1 | 0.02 | |
| Democratic | Al Gore | 1 | 0.02 | |
| Democratic | Joe Simonetta | 1 | 0.02 | |
| Total votes | 4,201 | 100% | ||
Democratic vice presidential nominee
| Party | Candidate | Votes | % | |
|---|---|---|---|---|
| Democratic | Walter Mondale (incumbent) | 2,429 | 72.90 | |
| Democratic | Abstaining | 728 | 21.85 | |
| Democratic | Melvin Boozer | 48 | 1.44 | |
| Democratic | Ed Rendell | 28 | 0.84 | |
| Democratic | Roberto Mondragón | 19 | 0.57 | |
| Democratic | Patricia Stone Simon | 11 | 0.33 | |
| Democratic | Tom Daschle | 10 | 0.30 | |
| Democratic | Ted Kulongoski | 8 | 0.24 | |
| Democratic | Shirley Chisholm | 6 | 0.18 | |
| Democratic | Terry Chisholm | 6 | 0.18 | |
| Democratic | Barbara Jordan | 4 | 0.12 | |
| Democratic | Rick Nolan | 4 | 0.12 | |
| Democratic | Patrick Lucey | 3 | 0.09 | |
| Democratic | Jerry Brown | 2 | 0.06 | |
| Democratic | George McGovern | 2 | 0.06 | |
| Democratic | Eric Tovar | 2 | 0.06 | |
| Democratic | Mo Udall | 2 | 0.06 | |
| Democratic | Others | 20 | 0.60 | |
| Total votes | 3,332 | 100% | ||
US Senate
| Primary election | ||||
|---|---|---|---|---|
| Party | Candidate | Votes | % | |
| Democratic | Jerry Brown | 1,392,660 | 50.67 | |
| Democratic | Gore Vidal | 415,366 | 15.11 | |
| Democratic | Paul B. Carpenter | 415,198 | 15.11 | |
| Democratic | Daniel K. Whitehurst | 167,574 | 6.10 | |
| Democratic | Richard Morgan | 94,908 | 3.45 | |
| Democratic | Tom Metzger | 76,502 | 2.78 | |
| Democratic | Walter R. Buchanan | 55,727 | 2.03 | |
| Democratic | Bob Hampton | 37,427 | 1.36 | |
| Democratic | Raymond Caplette | 31,865 | 1.16 | |
| Democratic | William F. Wertz | 30,795 | 1.12 | |
| Democratic | May Chote | 30,743 | 1.12 | |
| Write-in | 10 | 0.00 | ||
| Total votes | 2,748,775 | 100% | ||
| General election | ||||
| Republican | Pete Wilson | 4,022,565 | 51.54 | |
| Democratic | Jerry Brown | 3,494,968 | 44.78 | |
| Libertarian | Joseph Fuhrig | 107,720 | 1.38 | |
| Peace and Freedom | David Wald | 96,388 | 1.24 | |
| American Independent | Theresa F. Dietrich | 83,809 | 1.07 | |
| Write-in | 88 | 0.00 | ||
| Total votes | 7,805,538 | 100% | ||
Mayor
1998
| Party | Candidate | Votes | % | |
|---|---|---|---|---|
| Nonpartisan | Jerry Brown | 48,129 | 58.93 | |
| Nonpartisan | Edward J. Blakely | 12,226 | 14.97 | |
| Nonpartisan | Shannon F. Reeves | 5,679 | 6.95 | |
| Nonpartisan | Ignacio De La Fuente | 5,509 | 6.75 | |
| Nonpartisan | Mary V. King | 4,618 | 5.65 | |
| Nonpartisan | Ces Butner | 2,222 | 2.72 | |
| Nonpartisan | Audrey Rice Oliver | 1,245 | 1.52 | |
| Nonpartisan | Leo Bazile | 997 | 1.22 | |
| Nonpartisan | Hugh E. Bassette | 518 | 0.63 | |
| Nonpartisan | Maria G. Harper | 329 | 0.40 | |
| Nonpartisan | Hector Reyna | 207 | 0.25 | |
| Total votes | 81,679 | 100% | ||
2002
| Party | Candidate | Votes | % | |
|---|---|---|---|---|
| Nonpartisan | Jerry Brown (incumbent) | 42,892 | 63.54 | |
| Nonpartisan | Wilson Riles, Jr. | 24,611 | 36.46 | |
| Total votes | 67,503 | 100% | ||
Attorney general
| Primary election | ||||
|---|---|---|---|---|
| Party | Candidate | Votes | % | |
| Democratic | Jerry Brown | 1,552,922 | 63.22 | |
| Democratic | Rocky Delgadillo | 903,508 | 36.78 | |
| Total votes | 2,456,430 | 100% | ||
| General election | ||||
| Democratic | Jerry Brown | 4,756,184 | 56.29 | |
| Republican | Charles Poochigian | 3,220,429 | 38.11 | |
| Green | Michael Sutton Wyman | 195,130 | 2.31 | |
| Libertarian | Kenneth A. Weissman | 177,469 | 2.10 | |
| Peace and Freedom | Jack Harrison | 100,797 | 1.19 | |
| Total votes | 8,450,009 | 100% | ||
References
- "CA Secretary of State - D Primary". Our Campaigns. Retrieved 14 August 2021.
- Our Campaigns - CA Secretary of State Race - Nov 03, 1970
- Our Campaigns - CA Governor - D Primary Race - Jun 04, 1974
- Our Campaigns - CA Governor Race - Nov 05, 1974
- Our Campaigns - CA Governor - D Primary Race - Jun 06, 1978
- Our Campaigns - CA Governor Race - Nov 07, 1978
- "CA Governor - D Primary". Our Campaigns. Retrieved 15 August 2021.
- Our Campaigns - CA Governor Race - November 02, 2010
- "CA Governor - Open Primary". Our Campaigns. Retrieved 15 August 2021.
- Our Campaigns - CA Governor Race - November 04, 2014
- Our Campaigns - US President - D Primaries Race - Feb 01, 1976
- Our Campaigns - US President - D Primaries Race - Feb 26, 1980
- Our Campaigns - US President - D Convention Race - Aug 11, 1980
- "US President - D Primaries". Our Campaigns. Retrieved 15 August 2021.
- Our Campaigns - US President - D Convention Race - Jul 13, 1992
- Our Campaigns - US Vice President - D Convention Race - Aug 11, 1980
- Our Campaigns - CA US Senate - D Primary Race - Jun 08, 1982
- Our Campaigns - CA US Senate Race - Nov 05, 1982
- Our Campaigns - Oakland Mayor Race - Jun 02, 1998
- Our Campaigns - Oakland Mayor Race - Mar 05, 2002
- Our Campaigns - CA Attorney General - D Primary Race - Jun 06, 2006
- Our Campaigns - CA Attorney General Race - Nov 07, 2006
External links
- Profile at OurCampaigns.com
This article is issued from Wikipedia. The text is licensed under Creative Commons - Attribution - Sharealike. Additional terms may apply for the media files.