Demography of Bristol
Bristol, England is the tenth most populous city in the United Kingdom.

| Demographics of Bristol | |
|---|---|
 Population pyramid of Bristol | |
| Population | 428,234 (2011) |

Population
Bristol's total population, according to the 2011 UK census, was 428,234. The population density was 4,022 people per square km.
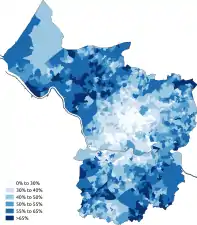
Ethnicity

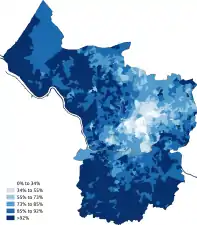
The following table shows the ethnic group of respondents in the 1991, 2001 and 2011 censuses in Bristol. Bristol has a strong White majority population, at 84%, which has declined from 94.5% in 1991. The largest ethnic group is the White British at 77.9% which have declined from 88% of the population in 2001. Black British residents are the 2nd biggest at 6% with Asian British at 5.5%.
| Ethnic Group | 1971 estimations[1] | 1981 estimations[2] | 1991[3] | 2001[4] | 2011[5] | 2021[6] | ||||||
|---|---|---|---|---|---|---|---|---|---|---|---|---|
| Number | % | Number | % | Number | % | Number | % | Number | % | Number | % | |
| White: Total | 396,543 | 97.7% | 363,366 | 96% | 356,865 | 94.87% | 349,530 | 91.83% | 359,592 | 83.97% | 383,142 | 81.1% |
| White: British | – | – | – | – | – | – | 335,085 | 88.04% | 333,432 | 77.86% | 338,452 | 71.6% |
| White: Irish | – | – | – | – | 5,571 | 1.48% | 4,321 | 1.14% | 3,851 | 0.90% | 4288 | 0.9% |
| White: Gypsy or Irish Traveller[note 1] | – | – | – | – | – | – | – | – | 359 | 0.08% | 273 | 0.1% |
| White: Roma | – | – | – | – | – | – | – | – | – | – | 966 | 0.2% |
| White: Other | – | – | – | – | – | – | 10,124 | 2.66% | 21,950 | 5.13% | 39,163 | 8.3% |
| Asian or Asian British: Total | – | – | – | – | 7,954 | 2.11% | 13,008 | 3.42% | 23,655 | 5.52% | 31,269 | 6.7% |
| Asian or Asian British: Indian | – | – | – | – | 2,773 | 0.73% | 4,595 | 1.21% | 6,547 | 1.53% | 8,302 | 1.8% |
| Asian or Asian British: Pakistani | – | – | – | – | 2,717 | 0.72% | 4,050 | 1.06% | 6,863 | 1.60% | 9,064 | 1.9% |
| Asian or Asian British: Bangladeshi | – | – | – | – | 557 | 0.14% | 1,230 | 0.32% | 2,104 | 0.49% | 2,616 | 0.6% |
| Asian or Asian British: Chinese[note 2] | – | – | – | – | 1,135 | 0.3% | 2,149 | 0.56% | 3,886 | 0.91% | 5,466 | 1.2% |
| Asian or Asian British: Other Asian | – | – | – | – | 772 | 0.2% | 984 | 0.26% | 4,255 | 0.99% | 5,821 | 1.2% |
| Black or Black British: Total | – | – | – | – | 8,905 | 2.36% | 8,831 | 2.32% | 25,734 | 6.01% | 27,890 | 5.8% |
| Black or Black British: African | – | – | – | – | 814 | 0.21% | 2,310 | 0.61% | 12,085 | 2.82% | 18,149 | 3.8% |
| Black or Black British: Caribbean | – | – | – | – | 5,971 | 1.58% | 5,585 | 1.47% | 6,727 | 1.57% | 6,803 | 1.4% |
| Black or Black British: Other Black | – | – | – | – | 2,120 | 0.56% | 936 | 0.25% | 6,922 | 1.62% | 2,938 | 0.6% |
| Mixed: Total | – | – | – | – | – | – | 7,934 | 2.08% | 15,438 | 3.61% | 21,116 | 4.5% |
| Mixed: White and Black Caribbean | – | – | – | – | – | – | 3,871 | 1.02% | 7,389 | 1.73% | 7,714 | 1.6% |
| Mixed: White and Black African | – | – | – | – | – | – | 755 | 0.20% | 1,533 | 0.36% | 2,621 | 0.6% |
| Mixed: White and Asian | – | – | – | – | – | – | 1,652 | 0.43% | 3,402 | 0.79% | 5,556 | 1.2% |
| Mixed: Other Mixed | – | – | – | – | – | – | 1,656 | 0.44% | 3,114 | 0.73% | 5,225 | 1.1% |
| Other: Total | – | – | – | – | 2,422 | 0.64% | 1,312 | 0.34% | 3,815 | 0.89% | 9,050 | 1.9% |
| Other: Arab[note 3] | – | – | – | – | – | – | – | – | 1,272 | 0.30% | 2,540 | 0.5% |
| Other: Any other ethnic group | – | – | – | – | 2,422 | 0.64% | 1,312 | 0.34% | 2,543 | 0.59% | 6,510 | 1.4% |
| Ethnic minority: Total | 9,499 | 2.3% | 15,279 | 4% | 19,281 | 5.1% | 31,085 | 8.2% | 68,642 | 16% | 89,325 | 18.9% |
| Total | 406,042 | 100% | 378,645 | 100% | 376,146 | 100% | 380,615 | 100% | 428,234 | 100% | 472,467 | 100% |
Notes for table above
- New category created for the 2011 census
- In 2001, listed under the 'Chinese or other ethnic group' heading.
- New category created for the 2011 census
 White
White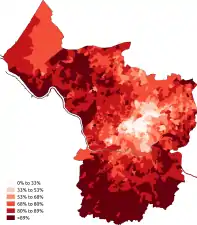 White-British
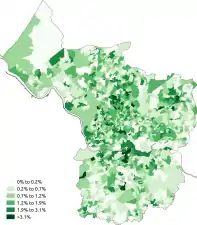 White-Irish
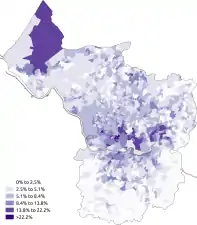 White-Other
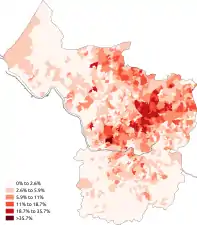 Asian
Asian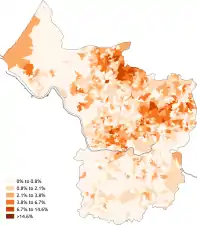 Asian-Indian
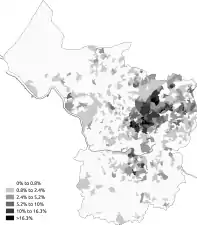 Asian-Pakistani
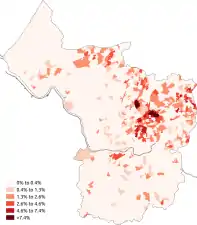 Asian-Bangladeshi
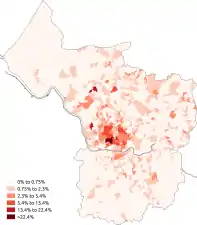 Asian-Chinese
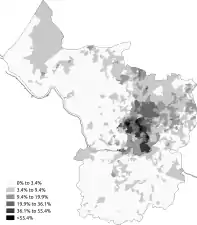 Black
Black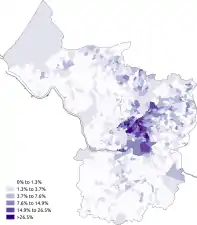 Black-African
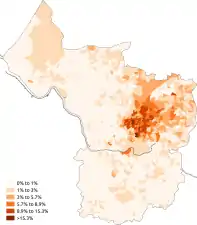 Black-Caribbean
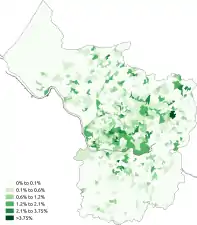 Other-Arab
| Ethnic group | School year[7][8] | |
|---|---|---|
| 2021/2022 | ||
| Number | % | |
| White: Total | 42,959 | 67.9% |
| White: British | 37,628 | 59.5% |
| White: Irish | 175 | |
| White: Traveller of Irish heritage | 44 | |
| White: Gypsy/Roma | 110 | |
| White: Other | 5,002 | |
| Asian / Asian British: Total | 5,380 | 8.5% |
| Asian / Asian British: Indian | 1,337 | |
| Asian / Asian British: Pakistani | 1,969 | |
| Asian / Asian British: Bangladeshi | 524 | |
| Asian / Asian British: Chinese | 396 | |
| Asian / Asian British: Other Asians | 1,154 | |
| Black / Black British: Total | 6,649 | 10.5% |
| Black: Caribbean | 905 | |
| Black: African | 4,731 | |
| Black: Other Blacks | 1,013 | |
| Mixed / British Mixed | 5,999 | 9.5% |
| Other: Total | 977 | 1.5% |
| Unclassified | 1,309 | 2.1% |
| Total: | 63,273 | 100% |
Languages
The most common main languages spoken in Bristol according to the 2011 census are shown below.[9]
| Rank | Language | Usual residents aged 3+ | Proportion |
|---|---|---|---|
| 1 | English | 374,709 | 91.46% |
| 2 | Polish | 6,080 | 1.48% |
| 3 | Somali | 5,004 | 1.22% |
| 4 | Urdu | 1,432 | 0.35% |
| 5 | French | 1,403 | 0.34% |
| 6 | Spanish | 1,329 | 0.32% |
| 7 | Punjabi | 1,306 | 0.32% |
| 8 | Arabic | 1,103 | 0.27% |
| 9 | Bengali (with Sylheti and Chatgaya) | 983 | 0.24% |
| 10 | Italian | 964 | 0.24% |
| 11 | Portuguese | 850 | 0.21% |
| 12 | German | 732 | 0.18% |
| 13 | Hungarian | 664 | 0.16% |
| 14 | Malayalam and Tamil | 663 | 0.16% |
| 15 | Russian | 536 | 0.13% |
| 16 | Tagalog/Filipino | 531 | 0.13% |
| 17 | Kurdish | 516 | 0.13% |
| 18 | Romanian | 503 | 0.12% |
| 19 | Greek | 494 | 0.12% |
| 20 | Slovak | 493 | 0.12% |
| other | 9,403 | 2.30% |
Religion
The following table shows the religion of respondents in the 2001, 2011 and 2021 censuses in Bristol.
| Religion | 2001[10] | 2011[11] | 2021[12] | |||
|---|---|---|---|---|---|---|
| Number | % | Number | % | Number | % | |
| No religion | 93,322 | 24.52 | 160,218 | 37.41 | 242,864 | 51.4 |
| Holds religious beliefs | 251,989 | 66.20 | 233,234 | 54.47 | 197,180 | 41.7 |
| 236,239 | 62.07 | 200,254 | 46.76 | 152,126 | 32.2 | |
| 7,664 | 2.01 | 22,016 | 5.14 | 31,776 | 6.7 | |
| 1,614 | 0.42 | 2,549 | 0.60 | 2,710 | 0.6 | |
| 2,131 | 0.56 | 2,712 | 0.63 | 3,545 | 0.8 | |
| 1,778 | 0.47 | 2,133 | 0.50 | 2,247 | 0.5 | |
| 823 | 0.22 | 777 | 0.18 | 1,228 | 0.3 | |
| Other religion | 1,740 | 0.46 | 2,793 | 0.65 | 3,546 | 0.8 |
| Religion not stated | 35,304 | 9.28 | 34,782 | 8.12 | 32,423 | 6.9 |
| Total population | 380,615 | 100.0 | 428,234 | 100.0 | 472,467 | 100.0 |
 Christianity
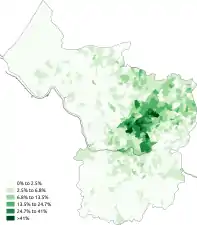 Islam
Islam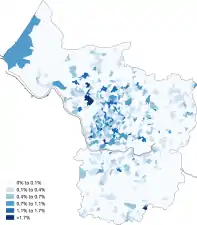 Judaism
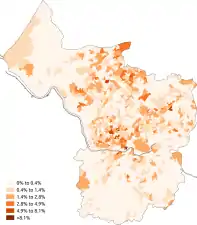 Hinduism
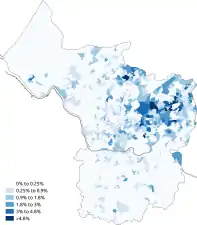 Sikhism
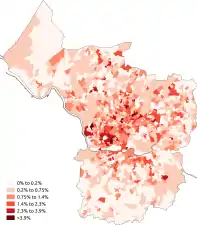 Buddhism
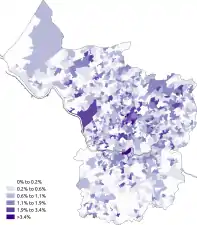 Other religion
 No religion
See also
- Demography of the United Kingdom
- Demography of England
- Demography of London
- Demography of Birmingham
- Demography of Greater Manchester
- List of English cities by population
- List of English districts by population
- List of English districts and their ethnic composition
- List of English districts by area
- List of English districts by population density
References
- Jones, P. N. (1978). "The Distribution and Diffusion of the Coloured Population in England and Wales, 1961-71". Transactions of the Institute of British Geographers. 3 (4): 515–532. doi:10.2307/622127. ISSN 0020-2754. JSTOR 622127. PMID 12157820.
- Equality, Commission for Racial (1985). "Ethnic minorities in Britain: statistical information on the pattern of settlement". Commission for Racial Equality: Table 2.2.
- Data is taken from United Kingdom Casweb Data services of the United Kingdom 1991 Census on Ethnic Data for England, Scotland and Wales (Table 6)
- "Office of National Statistics; 2001 Census Key Statistics". webarchive.nationalarchives.gov.uk. Retrieved 7 September 2021.
- "2011 Census: Ethnic Group, local authorities in England and Wales". webarchive.nationalarchives.gov.uk. Retrieved 15 December 2021.
- "Ethnic group - Office for National Statistics". www.ons.gov.uk. Retrieved 29 November 2022.
- "School and pupil characteristics". webarchive.nationalarchives.gov.uk. Retrieved 8 November 2022.
- "Schools, pupils and their characteristics, Academic Year 2021/22". explore-education-statistics.service.gov.uk. Retrieved 9 September 2022.
- "Download:local authorities: county / unitary". NOMIS. Retrieved 5 November 2015.
- "KS007 - Religion - Nomis - 2001". www.nomisweb.co.uk. Retrieved 18 October 2022.
- "KS209EW (Religion) - Nomis - 2011". www.nomisweb.co.uk. Retrieved 18 October 2022.
- "Religion - 2021 census". Office of National Statistics. 29 November 2022. Archived from the original on 29 November 2022. Retrieved 16 December 2022.