Delta County, Texas
Delta County is a county located in the U.S. state of Texas. As of the 2020 census, its population was 5,230.[1] Its county seat and largest city is Cooper.[2] The county was founded in 1870 and is named for its triangular shape,[3] which resembles the Greek letter delta.
Delta County | |
|---|---|
.jpg.webp) Delta County Courthouse in Cooper | |
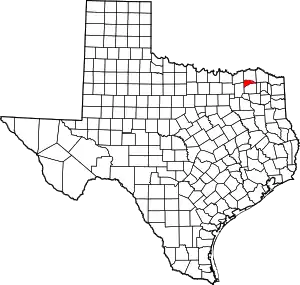
 Location within the U.S. state of Texas | |
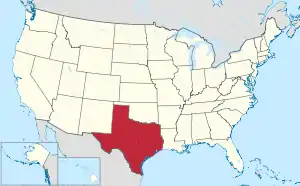
 Texas's location within the U.S. | |
| Coordinates: 33°23′N 95°40′W | |
| Country | |
| State | |
| Founded | 1870 |
| Seat | Cooper |
| Largest city | Cooper |
| Area | |
| • Total | 278 sq mi (720 km2) |
| • Land | 257 sq mi (670 km2) |
| • Water | 21 sq mi (50 km2) 7.6% |
| Population (2020) | |
| • Total | 5,230 |
| • Density | 19/sq mi (7.3/km2) |
| Time zone | UTC−6 (Central) |
| • Summer (DST) | UTC−5 (CDT) |
| Congressional district | 4th |
| Website | www |
Meanders of two forks of the Sulphur River formed its northern and southern boundaries and meet at its easternmost point. Delta County was one of 19[4] prohibition, or entirely dry, counties in the state of Texas. As of 2015, Delta County is no longer a dry county.
Geography
According to the U.S. Census Bureau, the county has a total area of 278 sq mi (720 km2), of which 257 sq mi (670 km2) are land and 21 sq mi (54 km2) (7.6%) are covered by water.[5]
Major highways
Adjacent counties
- Lamar County (north)
- Red River County (northeast)
- Franklin County (southeast)
- Hopkins County (south)
- Hunt County (southwest)
- Fannin County (northwest)
Communities
Cities
- Cooper
- Pecan Gap (small part in Fannin County)
- Commerce (majority in Hunt County)
Unincorporated communities
Ghost town
Demographics
| Census | Pop. | Note | %± |
|---|---|---|---|
| 1880 | 5,597 | — | |
| 1890 | 9,117 | 62.9% | |
| 1900 | 15,249 | 67.3% | |
| 1910 | 14,566 | −4.5% | |
| 1920 | 15,887 | 9.1% | |
| 1930 | 13,138 | −17.3% | |
| 1940 | 12,858 | −2.1% | |
| 1950 | 8,964 | −30.3% | |
| 1960 | 5,860 | −34.6% | |
| 1970 | 4,927 | −15.9% | |
| 1980 | 4,839 | −1.8% | |
| 1990 | 4,857 | 0.4% | |
| 2000 | 5,327 | 9.7% | |
| 2010 | 5,231 | −1.8% | |
| 2020 | 5,230 | 0.0% | |
| U.S. Decennial Census[6] 1850–2010[7] 2010–2020[8] | |||
| Race / Ethnicity | Pop 2010[9] | Pop 2020[8] | % 2010 | % 2020 |
|---|---|---|---|---|
| White alone (NH) | 4,351 | 4,189 | 83.18% | 80.10% |
| Black or African American alone (NH) | 375 | 312 | 7.17% | 5.97% |
| Native American or Alaska Native alone (NH) | 59 | 42 | 1.13% | 0.80% |
| Asian alone (NH) | 30 | 37 | 0.57% | 0.71% |
| Pacific Islander alone (NH) | 0 | 5 | 0.00% | 0.10% |
| Some Other Race alone (NH) | 11 | 30 | 0.21% | 0.57% |
| Mixed Race/Multi-Racial (NH) | 117 | 221 | 2.24% | 4.23% |
| Hispanic or Latino (any race) | 288 | 394 | 5.51% | 7.53% |
| Total | 5,231 | 5,230 | 100.00% | 100.00% |
Note: the US Census treats Hispanic/Latino as an ethnic category. This table excludes Latinos from the racial categories and assigns them to a separate category. Hispanics/Latinos can be of any race.
The 2020 U.S. census determined that Delta County had a population of 5,320.[8] Among its population, the racial and ethnic makeup was 80.10% non-Hispanic white, 5.97% African American, 0.80% Native American, 0.71% Asian, 0.10% Pacific Islander, 0.57% some other race, 4.23% multiracial, and 7.53% Hispanic or Latino of any race.
Politics
Delta County is represented in the Texas House of Representatives by Republican Larry Phillips of Sherman, Texas.
| Year | Republican | Democratic | Third party | |||
|---|---|---|---|---|---|---|
| No. | % | No. | % | No. | % | |
| 2020 | 2,162 | 83.41% | 403 | 15.55% | 27 | 1.04% |
| 2016 | 1,836 | 80.49% | 400 | 17.54% | 45 | 1.97% |
| 2012 | 1,524 | 75.52% | 454 | 22.50% | 40 | 1.98% |
| 2008 | 1,580 | 72.25% | 589 | 26.93% | 18 | 0.82% |
| 2004 | 1,447 | 69.50% | 627 | 30.12% | 8 | 0.38% |
| 2000 | 1,143 | 60.16% | 726 | 38.21% | 31 | 1.63% |
| 1996 | 744 | 42.69% | 849 | 48.71% | 150 | 8.61% |
| 1992 | 599 | 29.73% | 864 | 42.88% | 552 | 27.39% |
| 1988 | 849 | 40.41% | 1,244 | 59.21% | 8 | 0.38% |
| 1984 | 1,024 | 51.17% | 973 | 48.63% | 4 | 0.20% |
| 1980 | 767 | 35.81% | 1,347 | 62.89% | 28 | 1.31% |
| 1976 | 421 | 21.15% | 1,563 | 78.50% | 7 | 0.35% |
| 1972 | 957 | 61.90% | 581 | 37.58% | 8 | 0.52% |
| 1968 | 370 | 19.66% | 1,037 | 55.10% | 475 | 25.24% |
| 1964 | 339 | 17.30% | 1,619 | 82.60% | 2 | 0.10% |
| 1960 | 460 | 25.11% | 1,360 | 74.24% | 12 | 0.66% |
| 1956 | 605 | 32.23% | 1,262 | 67.23% | 10 | 0.53% |
| 1952 | 707 | 30.81% | 1,585 | 69.06% | 3 | 0.13% |
| 1948 | 146 | 7.68% | 1,594 | 83.89% | 160 | 8.42% |
| 1944 | 133 | 6.69% | 1,706 | 85.86% | 148 | 7.45% |
| 1940 | 190 | 7.90% | 2,214 | 92.10% | 0 | 0.00% |
| 1936 | 82 | 5.29% | 1,466 | 94.64% | 1 | 0.06% |
| 1932 | 87 | 4.14% | 2,013 | 95.81% | 1 | 0.05% |
| 1928 | 753 | 43.96% | 958 | 55.93% | 2 | 0.12% |
| 1924 | 479 | 17.64% | 2,186 | 80.49% | 51 | 1.88% |
| 1920 | 315 | 21.03% | 1,081 | 72.16% | 102 | 6.81% |
| 1916 | 72 | 4.97% | 1,254 | 86.48% | 124 | 8.55% |
| 1912 | 57 | 7.05% | 705 | 87.25% | 46 | 5.69% |
See also
References
- "U.S. Census Bureau QuickFacts: Delta County, Texas". United States Census Bureau. Retrieved January 31, 2022.
- "Find a County". National Association of Counties. Archived from the original on May 31, 2011. Retrieved June 7, 2011.
- Gannett, Henry (1905). The Origin of Certain Place Names in the United States. Govt. Print. Off. pp. 103.
- "TABC Local Option Elections". Retrieved July 29, 2018.
- "2010 Census Gazetteer Files". United States Census Bureau. August 22, 2012. Retrieved April 22, 2015.
- "Decennial Census of Population and Housing by Decades". US Census Bureau.
- "Texas Almanac: Population History of Counties from 1850–2010" (PDF). Texas Almanac. Archived (PDF) from the original on October 9, 2022. Retrieved April 22, 2015.
- "P2 HISPANIC OR LATINO, AND NOT HISPANIC OR LATINO BY RACE - 2020: DEC Redistricting Data (PL 94-171) - Delta County, Texas". United States Census Bureau.
- "P2 HISPANIC OR LATINO, AND NOT HISPANIC OR LATINO BY RACE - 2010: DEC Redistricting Data (PL 94-171) - Delta County, Texas". United States Census Bureau.
- Leip, David. "Dave Leip's Atlas of U.S. Presidential Elections". uselectionatlas.org. Retrieved July 21, 2018.