2006 California lieutenant gubernatorial election
The 2006 California lieutenant gubernatorial election occurred on November 7, 2006. Insurance Commissioner John Garamendi, the Democratic nominee, defeated the Republican nominee, State Senator Tom McClintock, to succeed incumbent Cruz Bustamante, who was term-limited and ran for Insurance Commissioner.
| |||||||||||||||||
| |||||||||||||||||
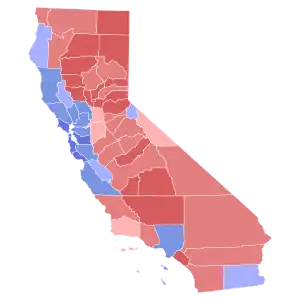
 County results Garamendi: 40–50% 50–60% 60–70% 70–80% McClintock: 40–50% 50–60% 60–70% | |||||||||||||||||
| |||||||||||||||||
| Elections in California |
|---|
 |
Primary results
The primary elections took place on June 6. A bar graph of statewide results in this contest are available at https://web.archive.org/web/20070517094419/http://primary2006.ss.ca.gov/Returns/ltg/00.htm.
Results by county are available here and here.
Candidates
- John Garamendi, Incumbent Insurance Commissioner, and candidate for governor in 1982, 1994, and 2003
- Jackie Speier, State Senator
- Liz Figueroa, State Senator
| Candidate | Votes | % | |
|---|---|---|---|
| John Garamendi | 1,045,130 | 42.53 | |
| Jackie Speier | 975,547 | 39.70 | |
| Liz Figueroa | 436,868 | 17.78 | |
| Total votes | 2,457,545 | 100.00 | |
Republican
| Candidate | Votes | % | |
|---|---|---|---|
| Tom McClintock | 1,760,667 | 93.75 | |
| Tony Farmer | 117,335 | 6.25 | |
| Total votes | 1,878,002 | 100.00 | |
Others
| Party | Candidate | Votes | % | |
|---|---|---|---|---|
| Green | Donna Warren | 31,162 | 100.00 | |
| American Independent | Jim King | 29,014 | 100.00 | |
| Libertarian | Lynette Shaw | 16,128 | 100.00 | |
| Peace and Freedom | Stewart Alexander | 3,549 | 100.00 | |
Results
| Party | Candidate | Votes | % | |
|---|---|---|---|---|
| Democratic | John Garamendi | 4,189,584 | 49.12 | |
| Republican | Tom McClintock | 3,845,858 | 45.09 | |
| Green | Donna Warren | 239,107 | 2.80 | |
| Libertarian | Lynnette Shaw | 142,851 | 1.67 | |
| American Independent | Jim King | 68,446 | 0.80 | |
| Peace and Freedom | Stewart Alexander | 43,319 | 0.51 | |
| Invalid or blank votes | 369,894 | 4.16 | ||
| Total votes | 8,529,165 | 100.00 | ||
| Turnout | 39.29 | |||
| Democratic hold | ||||
Results by county
Results from the Secretary of State of California:[1]
| County | Garamendi | Votes | McClintock | Votes | Warren | Votes | Others | Votes |
|---|---|---|---|---|---|---|---|---|
| San Francisco | 74.15% | 175,882 | 17.65% | 41,871 | 5.32% | 12,629 | 2.87% | 6,828 |
| Alameda | 68.48% | 270,885 | 25.46% | 100,689 | 4.49% | 17,777 | 2.72% | 10,741 |
| Marin | 64.85% | 67,170 | 28.94% | 29,978 | 3.98% | 4,126 | 3.05% | 3,159 |
| Santa Cruz | 63.30% | 55,352 | 28.59% | 25,001 | 5.64% | 4,935 | 3.56% | 3,117 |
| San Mateo | 62.67% | 125,199 | 32.50% | 64,934 | 3.52% | 7,033 | 2.24% | 4,482 |
| Sonoma | 60.70% | 103,019 | 32.59% | 55,320 | 4.60% | 7,808 | 3.51% | 5,962 |
| Los Angeles | 58.82% | 1,116,151 | 37.03% | 702,553 | 2.50% | 47,463 | 3.19% | 60,531 |
| Santa Clara | 57.61% | 238,352 | 37.56% | 155,389 | 2.91% | 12,050 | 3.27% | 13,509 |
| Contra Costa | 56.90% | 167,965 | 38.81% | 114,567 | 2.84% | 8,387 | 2.62% | 7,751 |
| Yolo | 54.05% | 28,845 | 40.83% | 21,793 | 3.72% | 1,983 | 1.94% | 1,035 |
| Mendocino | 54.09% | 16,179 | 35.58% | 10,641 | 7.11% | 2,128 | 4.76% | 1,422 |
| Monterey | 53.67% | 45,809 | 41.29% | 35,239 | 3.21% | 2,742 | 3.34% | 2,852 |
| Solano | 53.22% | 54,105 | 42.87% | 43,590 | 2.45% | 2,493 | 2.61% | 2,653 |
| Napa | 52.81% | 21,858 | 41.89% | 17,337 | 3.62% | 1,500 | 2.88% | 1,195 |
| Humboldt | 50.21% | 23,595 | 39.56% | 18,592 | 7.31% | 3,435 | 4.27% | 2,005 |
| Alpine | 48.95% | 257 | 42.67% | 224 | 4.76% | 25 | 3.81% | 20 |
| Imperial | 49.16% | 10,334 | 44.58% | 9,372 | 4.10% | 862 | 5.47% | 1,151 |
| San Benito | 48.32% | 6,745 | 47.31% | 6,604 | 2.62% | 366 | 3.51% | 489 |
| San Joaquin | 47.97% | 65,145 | 48.43% | 65,762 | 2.01% | 2,731 | 2.84% | 3,857 |
| Lake | 47.51% | 9,018 | 45.55% | 8,647 | 4.27% | 811 | 4.58% | 867 |
| Sacramento | 47.19% | 165,252 | 48.34% | 169,300 | 2.89% | 10,129 | 2.89% | 10,124 |
| Santa Barbara | 44.69% | 53,443 | 50.41% | 60,275 | 3.03% | 3,625 | 2.92% | 3,489 |
| Mono | 44.58% | 1,636 | 49.65% | 1,822 | 3.16% | 116 | 3.96% | 145 |
| Merced | 44.50% | 18,089 | 51.61% | 20,977 | 2.01% | 817 | 3.83% | 1,559 |
| Stanislaus | 43.19% | 44,106 | 53.75% | 54,885 | 1.84% | 1,878 | 2.29% | 2,330 |
| Del Norte | 42.58% | 2,761 | 51.62% | 3,347 | 3.01% | 195 | 4.85% | 315 |
| Calaveras | 42.21% | 7,513 | 53.67% | 9,553 | 2.38% | 424 | 2.82% | 502 |
| San Diego | 41.60% | 311,988 | 54.10% | 405,673 | 2.58% | 19,369 | 2.94% | 22,008 |
| Ventura | 41.32% | 89,988 | 55.14% | 120,089 | 2.03% | 4,429 | 2.48% | 5,397 |
| San Bernardino | 41.45% | 138,032 | 54.29% | 180,824 | 2.37% | 7,909 | 3.64% | 12,126 |
| Tuolumne | 40.65% | 8,491 | 55.14% | 11,517 | 2.56% | 534 | 2.66% | 555 |
| San Luis Obispo | 39.68% | 37,591 | 55.46% | 52,536 | 3.13% | 2,964 | 2.69% | 2,545 |
| Nevada | 39.07% | 16,613 | 54.73% | 23,275 | 4.11% | 1,749 | 2.60% | 1,105 |
| Fresno | 39.14% | 67,506 | 57.15% | 98,580 | 2.20% | 3,792 | 2.84% | 4,882 |
| Trinity | 38.74% | 2,199 | 51.92% | 2,947 | 5.39% | 306 | 5.06% | 287 |
| Amador | 38.72% | 5,697 | 57.41% | 8,448 | 2.26% | 333 | 2.78% | 409 |
| Riverside | 38.72% | 144,014 | 57.42% | 213,564 | 2.07% | 7,712 | 3.52% | 13,119 |
| Butte | 37.53% | 25,282 | 56.07% | 37,774 | 4.15% | 2,797 | 3.70% | 2,497 |
| Mariposa | 36.81% | 2,749 | 57.97% | 4,330 | 3.07% | 229 | 3.54% | 264 |
| Kings | 35.59% | 7,925 | 61.11% | 13,608 | 1.90% | 422 | 3.04% | 678 |
| Siskiyou | 35.12% | 5,700 | 59.16% | 9,602 | 3.04% | 493 | 4.32% | 700 |
| Plumas | 35.01% | 3,047 | 60.00% | 5,221 | 2.86% | 249 | 3.51% | 305 |
| Orange | 34.41% | 244,176 | 61.94% | 439,549 | 2.10% | 14,911 | 2.69% | 19,038 |
| Inyo | 34.55% | 2,165 | 59.14% | 3,706 | 3.42% | 214 | 4.90% | 307 |
| El Dorado | 33.96% | 22,634 | 61.48% | 40,982 | 2.77% | 1,845 | 2.71% | 1,808 |
| Placer | 33.58% | 40,770 | 62.67% | 76,098 | 2.27% | 2,759 | 2.31% | 2,795 |
| Madera | 33.67% | 9,988 | 62.92% | 18,665 | 1.85% | 550 | 2.83% | 839 |
| Tulare | 32.83% | 22,240 | 64.29% | 43,553 | 1.66% | 1,122 | 2.55% | 1,722 |
| Yuba | 31.70% | 4,283 | 62.69% | 8,470 | 3.42% | 462 | 3.96% | 534 |
| Lassen | 30.97% | 2,613 | 63.71% | 5,376 | 2.89% | 244 | 3.65% | 308 |
| Sutter | 30.81% | 7,166 | 65.99% | 15,347 | 1.80% | 419 | 2.80% | 653 |
| Colusa | 30.42% | 1,470 | 66.73% | 3,225 | 1.82% | 88 | 2.44% | 118 |
| Kern | 30.36% | 44,516 | 66.17% | 97,035 | 1.96% | 2,869 | 2.94% | 4,319 |
| Tehama | 30.55% | 5,345 | 65.47% | 11,454 | 1.85% | 324 | 4.15% | 726 |
| Shasta | 30.08% | 17,231 | 65.76% | 37,668 | 2.18% | 1,249 | 3.52% | 2,016 |
| Sierra | 29.60% | 462 | 63.61% | 993 | 4.16% | 65 | 4.16% | 65 |
| Glenn | 28.00% | 2,052 | 68.27% | 5,003 | 1.87% | 137 | 3.36% | 246 |
| Modoc | 26.87% | 986 | 67.68% | 2,484 | 2.56% | 94 | 4.22% | 155 |
See also
References
- "Lieutenant Governor" (PDF). Secretary of State of California. December 16, 2006. Archived from the original (PDF) on July 17, 2008. Retrieved July 16, 2008.
- "Registration and Participation" (PDF). Secretary of State of California. December 18, 2006. Archived from the original (PDF) on July 17, 2008. Retrieved July 16, 2008.
External links
This article is issued from Wikipedia. The text is licensed under Creative Commons - Attribution - Sharealike. Additional terms may apply for the media files.
.jpg.webp)
.jpg.webp)