1970 Australian Senate election
An election was held on 21 November 1970 to elect 32 of the 60 seats in the Australian Senate. This is the most recent occasion on which a Senate election has been held with no accompanying election to the House of Representatives; the two election cycles had been out of synchronisation since 1963.
| |||||||||||||||||||||||||||||||||||||
32 of the 60 seats in the Senate 16 seats needed for a majority | |||||||||||||||||||||||||||||||||||||
|---|---|---|---|---|---|---|---|---|---|---|---|---|---|---|---|---|---|---|---|---|---|---|---|---|---|---|---|---|---|---|---|---|---|---|---|---|---|
| |||||||||||||||||||||||||||||||||||||
Key dates
| Date | Event |
|---|---|
| 16 October 1970 | Writs were issued by the respective State Governors to proceed with an election.[1][2][3] |
| 29 October 1970 | Close of nominations, at 12pm. |
| 21 November 1970 | Polling day, between the hours of 8am and 6pm. |
| 17 December 1970 | Declaration of the poll for South Australia.[4] |
| 7 January 1971 | Return of the writs. |
Results
The governing Coalition and the opposition Australian Labor Party won 13 and 14 seats respectively, resulting in a total of 26 seats each, while the Democratic Labor Party and three independents (two newly elected) held the remaining seats.
| Party | Votes | % | Swing | Seats won | Seats held | Change | ||
|---|---|---|---|---|---|---|---|---|
| Labor | 2,376,215 | 42.22 | –2.81 | 14 | 26 | –1 | ||
| Liberal–Country coalition (total) | 2,149,023 | 38.18 | –4.59 | 13 | 26 | –2 | ||
| Liberal–Country joint ticket | 1,098,134 | 19.51 | –14.31 | 4 | * | * | ||
| Liberal | 991,473 | 17.61 | +9.47 | 8 | 21 | 0 | ||
| Country | 59,416 | 1.06 | +0.24 | 1 | 5 | –2 | ||
| Democratic Labor | 625,142 | 11.11 | +1.34 | 3 | 5 | +1 | ||
| Australia | 163,343 | 2.90 | +2.90 | 0 | 0 | 0 | ||
| Better Education Committee | 59,813 | 1.06 | +1.06 | 0 | 0 | 0 | ||
| Democratic | 52,799 | 0.94 | +0.94 | 0 | 0 | 0 | ||
| Pensioner Power | 28,983 | 0.51 | +0.51 | 0 | 0 | 0 | ||
| Defence of Government Schools | 27,796 | 0.49 | +0.49 | 0 | 0 | 0 | ||
| National Socialist | 24,017 | 0.43 | +0.43 | 0 | 0 | 0 | ||
| Conservative Immigration Movement | 4,864 | 0.08 | +0.08 | 0 | 0 | 0 | ||
| Independent | 116,838 | 2.07 | +0.37 | 2 | 3 | +2 | ||
| Total | 5,628,833 | 32 | 60 | |||||
- Notes
- In New South Wales and Queensland, the coalition parties ran a joint ticket. Of the four senators elected on a joint ticket, three were members of the Liberal Party and one was a member of the Country Party. In Western Australia, the coalition parties ran on separate tickets. In South Australia, Tasmania, and Victoria, only the Liberal Party ran a ticket.
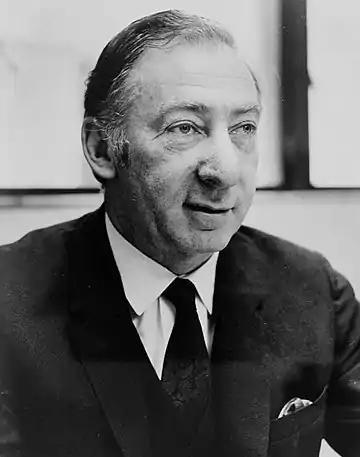
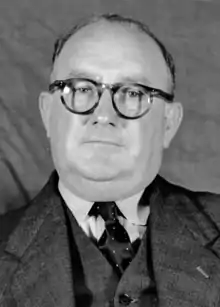
- Two independents were elected – Michael Townley of Tasmania and Syd Negus of Western Australia. This brought the total number of independents in the Senate to three, the other being Reg Turnbull of Tasmania.[5]
See also
References
-
- "Election of Senators Act, 1903. Proclamation" (PDF). Western Australia Government Gazette. 7 October 1970. p. 3117.
- "Senate Elections Act 1958 (No. 6365) (per 9145/70)". Victoria Government Gazette. Victorian Government Printer. 7 October 1970. p. 3309.
- "Senators' Elections Act 1903: Order under Section 3 (136)". Government Gazette of the State of New South Wales. 14 October 1970. p. 4142. Retrieved 10 October 2020.
- "Election of Senators for the State of South Australia (Proclamation) (44)" (PDF). South Australian Government Gazette. Government of South Australia. 6 October 1970. p. 1501. Retrieved 10 October 2020.
- Parliamentary Handbook – Members of the Senate since 1901 Archived 25 July 2008 at the Wayback Machine
External links
- University of WA Archived 18 January 2015 at the Wayback Machine election results in Australia since 1890
This article is issued from Wikipedia. The text is licensed under Creative Commons - Attribution - Sharealike. Additional terms may apply for the media files.


