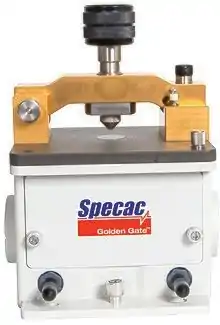
Attenuated total reflectance
Attenuated total reflection (ATR) is a sampling technique used in conjunction with infrared spectroscopy which enables samples to be examined directly in the solid or liquid state without further preparation.[1]


ATR uses a property of total internal reflection resulting in an evanescent wave. A beam of infrared light is passed through the ATR crystal in such a way that it reflects at least once off the internal surface in contact with the sample. This reflection forms the evanescent wave which extends into the sample. The penetration depth into the sample is typically between 0.5 and 2 micrometres, with the exact value determined by the wavelength of light, the angle of incidence and the indices of refraction for the ATR crystal and the medium being probed.[2] The number of reflections may be varied by varying the angle of incidence. The beam is then collected by a detector as it exits the crystal. Most modern infrared spectrometers can be converted to characterise samples via ATR by mounting the ATR accessory in the spectrometer's sample compartment. The accessibility, rapid sample turnaround and ease of ATR-FTIR has led to substantial use by the scientific community.
This evanescent effect only works if the crystal is made of an optical material with a higher refractive index than the sample being studied. Otherwise light is lost to the sample. In the case of a liquid sample, pouring a shallow amount over the surface of the crystal is sufficient. In the case of a solid sample, samples are firmly clamped to ensure good contact is made and to remove trapped air that would reduce signal intensity. The signal to noise ratio obtained depends on the number of reflections but also on the total length of the optical light path which dampens the intensity. Therefore, a general claim that more reflections give better sensitivity cannot be made.
Typical materials for ATR crystals include germanium, KRS-5 and zinc selenide, while silicon is ideal for use in the Far-IR region of the electromagnetic spectrum. The excellent mechanical properties of diamond make it an ideal material for ATR, particularly when studying very hard solids, although the broad diamond phonon band between 2600 and 1900 cm−1 significantly decreases signal to noise in this region. The shape of the crystal depends on the type of spectrometer and nature of the sample. With dispersive spectrometers, the crystal is a rectangular slab with chamfered edges, seen in cross-section in the illustrations. Other geometries use prisms, half-spheres, or thin sheets.
Applications
Infrared (IR) spectroscopy by ATR is applicable to the same chemical or biological systems as the transmission method. One advantage of ATR-IR over transmission-IR is the limited path length into the sample. This avoids the problem of strong attenuation of the IR signal in highly absorbing media such as aqueous solutions. For ultraviolet or visible light (UV/Vis) the evanescent light path is sufficiently short such that interaction with the sample is decreased with wavelength. For optically dense samples, this may allow for measurements with UV. Also, as no light path has to be established single shaft probes are used for process monitoring and are applicable in both the near and mid infrared spectrum.
Recently, ATR-IR has been applied to microfluidic flows of aqueous solutions by engineering microreactors with built-in apertures for the ATR crystal, allowing the flow within microchannels to pass across the crystal surface for characterisation,[3] or in dedicated flow cells.[4][5] Due to the ATR geometry and the resulting evanescent wave, it is possible with this technique to study transport phenomena and sorption kinetics through thin films.[6] The ability to passively characterise samples, with no sample preparation has also led to the use of ATR-FTIR in studying trace evidence in forensic science.
ATR-FTIR is also used as a tool in pharmacological research to investigate protein/pharmaceutical interactions in detail. Water-soluble proteins to be investigated require Polyhistidine-tags, allowing the macromolecule to be anchored to a lipid bilayer, which is attached to a Germanium crystal or other suitable optical media. Internal reflection with and without applied pharmaceutical or ligand will produce difference spectra to study conformational changes of the proteins upon binding.[7]
Sources
- "FT-IR Spectroscopy—Attenuated Total Reflectance (ATR)" (PDF). Perkin Elmer Life and Analytical Sciences. 2005. Archived from the original (PDF) on 2007-02-16. Retrieved 2007-01-26.
- F. M. Mirabella, Jr., Practical Spectroscopy Series; Internal reflection spectroscopy: Theory and applications, Marcel Dekker, Inc.; Marcel Dekker, Inc., 1993, 17-52.
- Jesse Greener, Bardia Abbasi, Eugenia Kumacheva, Attenuated total reflection Fourier transform spectroscopy for on-chip monitoring of solute concentrations, Lab Chip, 10 (2010) 1561-1566.
- Carter, Catherine F. (2010). "ReactIR Flow Cell: A New Analytical Tool for Continuous Flow Chemical Processing". Organic Process Research & Development. 14 (2): 393–404. doi:10.1021/op900305v.
- Minnich, Clemens B. (2010). "Determination of the Dispersion Characteristics of Miniaturized Coiled Reactors with Fiber-Optic Fourier Transform Mid-infrared Spectroscopy". Industrial & Engineering Chemistry Research. 49 (12): 5530–5535. doi:10.1021/ie901094q.
- Sammon, C.; Yarwood, J.; Everall, N. (March 2000). "A FTIR–ATR study of liquid diffusion processes in PET films: comparison of water with simple alcohols". Polymer. 41 (7): 2521–2534. doi:10.1016/S0032-3861(99)00405-X.
- Pinkerneil, Philipp; Güldenhaupt, Jörn; Gerwert, Klaus; Kötting, Carsten (2012). "Surface-Attached Polyhistidine-Tag Proteins Characterized by FTIR Difference Spectroscopy". ChemPhysChem. 13 (11): 2649–2653. doi:10.1002/cphc.201200358. PMC 3531609. PMID 22707114.
Bibliography
- Harrick, N.J. (1967). Internal Reflection Spectroscopy. John Wiley & Sons Inc. p. 342. ISBN 978-0-470-35250-2.
- "Fourier Transform Infrared Spectroscopy (FT-IR)". nuance.northwestern.edu. Northwestern University Atomic and Nanoscale Characterization Experimental Center. Archived from the original on May 24, 2014.