Altamont, Utah
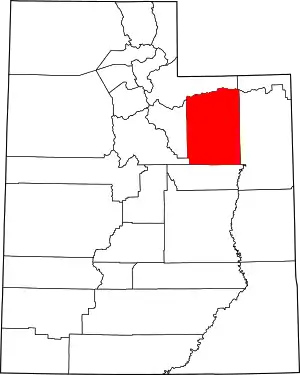
Altamont is a town in Duchesne County, Utah, United States. The population was 225 at the 2010 census,[5] an increase over the 2000 figure of 178.
Altamont | |
|---|---|
Town | |
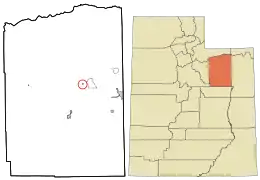
 Location in Duchesne County and the state of Utah | |
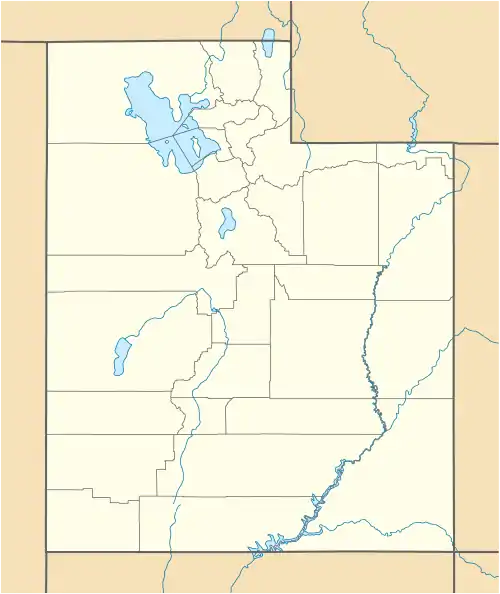
 Altamont  Altamont | |
| Coordinates: 40°21′35″N 110°17′13″W | |
| Country | United States |
| State | Utah |
| County | Duchesne |
| Settled | 1930s |
| Incorporated | 1953 |
| Named for | Altonah and Mount Emmons |
| Area | |
| • Total | 0.21 sq mi (0.55 km2) |
| • Land | 0.21 sq mi (0.55 km2) |
| • Water | 0.00 sq mi (0.00 km2) |
| Elevation | 6,388 ft (1,947 m) |
| Population (2010) | |
| • Total | 225 |
| • Estimate (2019)[2] | 277 |
| • Density | 1,306.60/sq mi (504.58/km2) |
| Time zone | UTC-7 (MST) |
| • Summer (DST) | UTC-6 (MDT) |
| ZIP code | 84001 |
| Area code | 435 |
| FIPS code | 49-00760[3] |
| GNIS feature ID | 1425096[4] |
History
The town was settled in the 1930s as a central location for a new area high school. The school was finished in 1935 and named Altamont, combining the names of the area villages of Altonah and Mt. Emmons. The community grew gradually and petitioned to incorporate as a town in 1953.[6] In 2012 the newest addition to the school was finished.
Geography
According to the United States Census Bureau, the town has a total area of 0.2 square mile (0.4 km2), all land.
Climate
Altamont has a cold semi-arid climate (Köppen BSk) with cold winters and warm summers.
| Climate data for Altamont, Utah, 1991–2020 normals, extremes 1948–present | |||||||||||||
|---|---|---|---|---|---|---|---|---|---|---|---|---|---|
| Month | Jan | Feb | Mar | Apr | May | Jun | Jul | Aug | Sep | Oct | Nov | Dec | Year |
| Record high °F (°C) | 59 (15) |
69 (21) |
76 (24) |
86 (30) |
90 (32) |
98 (37) |
97 (36) |
95 (35) |
90 (32) |
80 (27) |
69 (21) |
64 (18) |
98 (37) |
| Mean maximum °F (°C) | 43.7 (6.5) |
50.4 (10.2) |
64.1 (17.8) |
73.3 (22.9) |
80.6 (27.0) |
88.1 (31.2) |
92.1 (33.4) |
89.8 (32.1) |
84.4 (29.1) |
73.1 (22.8) |
58.4 (14.7) |
46.6 (8.1) |
92.7 (33.7) |
| Average high °F (°C) | 28.9 (−1.7) |
34.8 (1.6) |
47.0 (8.3) |
55.1 (12.8) |
64.2 (17.9) |
75.1 (23.9) |
82.4 (28.0) |
80.1 (26.7) |
71.0 (21.7) |
57.4 (14.1) |
42.6 (5.9) |
29.4 (−1.4) |
55.7 (13.2) |
| Daily mean °F (°C) | 17.8 (−7.9) |
23.1 (−4.9) |
33.9 (1.1) |
41.1 (5.1) |
50.2 (10.1) |
59.5 (15.3) |
66.9 (19.4) |
65.0 (18.3) |
56.1 (13.4) |
43.6 (6.4) |
30.5 (−0.8) |
18.9 (−7.3) |
42.2 (5.7) |
| Average low °F (°C) | 6.7 (−14.1) |
11.5 (−11.4) |
20.9 (−6.2) |
27.2 (−2.7) |
36.2 (2.3) |
44.0 (6.7) |
51.5 (10.8) |
49.9 (9.9) |
41.2 (5.1) |
29.9 (−1.2) |
18.4 (−7.6) |
8.4 (−13.1) |
28.8 (−1.8) |
| Mean minimum °F (°C) | −7.1 (−21.7) |
−2.9 (−19.4) |
8.5 (−13.1) |
16.0 (−8.9) |
25.3 (−3.7) |
33.8 (1.0) |
44.2 (6.8) |
42.5 (5.8) |
30.8 (−0.7) |
17.8 (−7.9) |
5.8 (−14.6) |
−5.2 (−20.7) |
−10.5 (−23.6) |
| Record low °F (°C) | −30 (−34) |
−32 (−36) |
−11 (−24) |
5 (−15) |
16 (−9) |
25 (−4) |
34 (1) |
28 (−2) |
19 (−7) |
−6 (−21) |
−8 (−22) |
−32 (−36) |
−32 (−36) |
| Average precipitation inches (mm) | 0.69 (18) |
0.62 (16) |
0.53 (13) |
0.83 (21) |
1.08 (27) |
0.77 (20) |
0.60 (15) |
0.96 (24) |
1.24 (31) |
0.99 (25) |
0.51 (13) |
0.62 (16) |
9.44 (240) |
| Average snowfall inches (cm) | 10.8 (27) |
7.5 (19) |
3.0 (7.6) |
3.2 (8.1) |
0.1 (0.25) |
0.0 (0.0) |
0.0 (0.0) |
0.0 (0.0) |
0.1 (0.25) |
0.8 (2.0) |
4.2 (11) |
9.0 (23) |
38.7 (98) |
| Average precipitation days (≥ 0.01 in) | 4.7 | 4.9 | 4.0 | 5.2 | 6.7 | 4.8 | 5.2 | 6.6 | 5.9 | 5.1 | 4.2 | 4.6 | 61.9 |
| Average snowy days (≥ 0.1 in) | 4.3 | 4.0 | 1.9 | 1.4 | 0.1 | 0.0 | 0.0 | 0.0 | 0.0 | 0.5 | 2.2 | 4.3 | 18.7 |
| Source: NOAA[7][8] | |||||||||||||
Demographics
| Census | Pop. | Note | %± |
|---|---|---|---|
| 1960 | 102 | — | |
| 1970 | 129 | 26.5% | |
| 1980 | 247 | 91.5% | |
| 1990 | 167 | −32.4% | |
| 2000 | 178 | 6.6% | |
| 2010 | 225 | 26.4% | |
| 2019 (est.) | 277 | [2] | 23.1% |
| U.S. Decennial Census[9] | |||
[10][11] As of the census of 2010, there were 225 people in 83 households in the town. The racial makeup of the town was 96% White, 2% Native American, and 1.3% from Hispanic or Latino.
The population was 46 percent male and 54 percent female. The population was 31.6 percent under 18 and 12.9 percent 65 or over.
Education
The town is home to Altamont High School. The school mascot is Louie the Longhorn. Altamont competes as a 1A school and has local rivalries with Duchesne and Tabiona.
References
- "2019 U.S. Gazetteer Files". United States Census Bureau. Retrieved August 7, 2020.
- "Population and Housing Unit Estimates". United States Census Bureau. May 24, 2020. Retrieved May 27, 2020.
- "U.S. Census website". United States Census Bureau. Retrieved January 31, 2008.
- "US Board on Geographic Names". United States Geological Survey. October 25, 2007. Retrieved January 31, 2008.
- "2010 US Census". Archived from the original on October 10, 2013. Retrieved March 26, 2012.
- Barton, John D. (January 1998). A History of Duchesne County. Utah Centennial County History Series. Salt Lake City: Utah State Historical Society. p. 189. ISBN 0-913738-41-7.
- "NOWData – NOAA Online Weather Data". National Oceanic and Atmospheric Administration. Retrieved November 25, 2022.
- "Summary of Monthly Normals 1991–2020". National Oceanic and Atmospheric Administration. Retrieved December 10, 2022.
- "Census of Population and Housing". Census.gov. Retrieved June 4, 2015.
- United States Census
- "Archived copy" (PDF). Archived from the original (PDF) on October 3, 2018. Retrieved March 15, 2014.
{{cite web}}: CS1 maint: archived copy as title (link)
