2016 United States presidential election in North Dakota
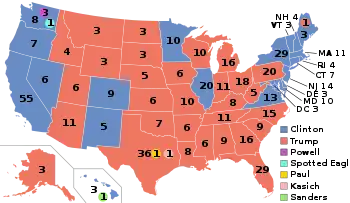
The 2016 United States presidential election in North Dakota was held on Tuesday, November 8, 2016, as part of the 2016 United States presidential election in which all 50 states plus the District of Columbia participated. North Dakota voters chose electors to represent them in the Electoral College via a popular vote, pitting the Republican Party's nominee, businessman Donald Trump, and running mate Indiana Governor Mike Pence against Democratic Party nominee, former Secretary of State Hillary Clinton, and her running mate Virginia Senator Tim Kaine. North Dakota has three electoral votes in the Electoral College.[1]
| |||||||||||||||||||||||||||||||||
| Turnout | 61.29% | ||||||||||||||||||||||||||||||||
|---|---|---|---|---|---|---|---|---|---|---|---|---|---|---|---|---|---|---|---|---|---|---|---|---|---|---|---|---|---|---|---|---|---|
| |||||||||||||||||||||||||||||||||


| |||||||||||||||||||||||||||||||||
| |||||||||||||||||||||||||||||||||
.jpg.webp)


| Elections in North Dakota |
|---|
 |
On June 7, 2016, as part of the Democratic Party presidential primaries, North Dakota voters expressed their preferences for the Democratic party's nominees for president. As North Dakota does not have a voter registration system,[2] all voters could choose to participate in this caucus. Due to a disagreement about the binding of delegates between state and national party leaders, no Republican Party primary or caucus was held. Instead, delegates were chosen at the state party convention April 1–3.[3]
Trump won the election in North Dakota with 63.0% of the vote, making it his fourth-strongest state in the 2016 election, after West Virginia, Wyoming, and Oklahoma.[4] Clinton received 27.2% of the vote.[5] This makes it the largest loss by a Democrat since Democratic nominee Jimmy Carter in 1980. The state also gave North Dakota-born Libertarian Party candidate Gary Johnson his second-best showing with 6.2% of the vote, only behind the 9.3% vote share that he received in his home state of New Mexico.
Caucuses
Democratic caucus
Three candidates appeared on the Democratic presidential primary ballot:
| North Dakota Democratic caucuses, June 7, 2016 | |||||
|---|---|---|---|---|---|
| Candidate | District delegates | State delegates | |||
| Count | Percentage | Pledged | Unpledged | Total | |
| Bernie Sanders | 253 | 64.21% | 13 | 1 | 14 |
| Hillary Clinton | 101 | 25.63% | 5 | 1 | 6 |
| Uncommitted | 40 | 10.15% | 0 | 0 | 0 |
| Total | 394 | 100% | 18 | 5 | 23 |
| Source: The Green Papers | |||||
Republican convention
The North Dakota Republican Party did not hold a presidential preference caucus or primary, but instead selected 28 Republican National Convention delegates unpledged to any particular candidate at the state party convention, which was held April 1–3, 2016.[3] A generally pro-Cruz slate of delegates was elected to the convention.[6] Cruz had the support of 14 delegates before he dropped out of the race. Three of them switched to Trump on May 27 along with all 13 of the uncommitted delegates giving Trump the majority of commitments and the support of 17 delegates (Trump had the support of 1 delegate before Cruz dropped out).
| Candidate | Actual delegate count | ||||
|---|---|---|---|---|---|
| Bound | Unbound | Total | |||
| Donald Trump | 0 | 17 | 17 | ||
| Ted Cruz | 0 | 11 | 11 | ||
| John Kasich | 0 | 0 | 0 | ||
| (available) | 0 | 0 | 0 | ||
| Unprojected delegates: | 0 | 0 | 0 | ||
| Total: | 0 | 28 | 28 | ||
| Source: The Green Papers | |||||
General Election
Voting history
North Dakota joined the Union in November 1889 and has participated in all elections from 1892 onwards.
Since 1900, North Dakota voted Democratic 17.24 percent of the time and Republican 82.76 percent of the time.
Since 1968, the state has always voted Republican.
Predictions
The following are final 2016 predictions from various organizations for North Dakota as of Election Day.
| Source | Ranking | As of |
|---|---|---|
| Los Angeles Times[7] | Safe R | November 6, 2016 |
| CNN[8] | Safe R | November 8, 2016 |
| Sabato's Crystal Ball[9] | Safe R | November 7, 2016 |
| NBC[10] | Likely R | November 7, 2016 |
| RealClearPolitics[11] | Safe R | November 8, 2016 |
| Fox News[12] | Safe R | November 7, 2016 |
| ABC[13] | Safe R | November 7, 2016 |
Results
| Party | Candidate | Votes | % | ||
|---|---|---|---|---|---|
| Republican | 216,794 | 62.96 | |||
| Democratic–NPL | 93,758 | 27.23 | |||
| Libertarian | 21,434 | 6.22 | |||
| Green | 3,780 | 1.10 | |||
| Constitution |
|
1,833 | 0.53 | ||
| American Delta | 364 | 0.11 | |||
| Write-in | 6,397 | 1.86 | |||
| Total votes | 344,360 | 100% | |||
| Republican win | |||||
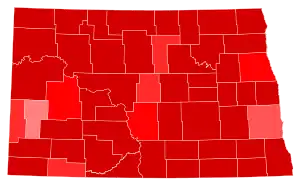
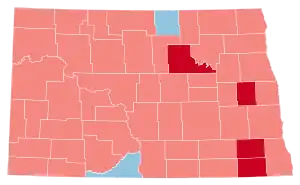
Results by county were as follows.[15][16]
| Donald Trump Republican |
Hillary Clinton Democratic-NPL |
Gary Johnson Libertarian |
Write-in | Jill Stein Green |
Darrell Castle Constitution |
Rocky De La Fuente American Delta |
Margin | Total | ||||||||||
|---|---|---|---|---|---|---|---|---|---|---|---|---|---|---|---|---|---|---|
| County | Votes | % | Votes | % | Votes | % | Votes | % | Votes | % | Votes | % | Votes | % | Votes | % | Votes | Turnout |
| Adams | 909 | 74.63% | 216 | 17.73% | 65 | 5.34% | 7 | 0.57% | 8 | 0.66% | 13 | 1.07% | 0 | 0.00% | 693 | 56.90% | 1,218 | 64.31% |
| Barnes | 3,160 | 59.13% | 1,597 | 29.88% | 407 | 7.62% | 86 | 1.61% | 47 | 0.88% | 41 | 0.77% | 6 | 0.11% | 1,563 | 29.25% | 5,344 | 61.46% |
| Benson | 929 | 46.20% | 842 | 41.87% | 112 | 5.57% | 69 | 3.43% | 41 | 2.04% | 17 | 0.85% | 1 | 0.05% | 87 | 4.33% | 2,011 | 45.97% |
| Billings | 495 | 81.82% | 59 | 9.75% | 33 | 5.45% | 7 | 1.16% | 4 | 0.66% | 6 | 0.99% | 1 | 0.17% | 436 | 72.07% | 605 | 83.56% |
| Bottineau | 2,494 | 71.38% | 736 | 21.06% | 177 | 5.07% | 43 | 1.23% | 30 | 0.86% | 11 | 0.31% | 3 | 0.09% | 1,758 | 50.32% | 3,494 | 67.61% |
| Bowman | 1,446 | 80.92% | 227 | 12.70% | 79 | 4.42% | 16 | 0.90% | 13 | 0.73% | 4 | 0.22% | 2 | 0.11% | 1,219 | 68.22% | 1,787 | 73.82% |
| Burke | 895 | 85.08% | 119 | 11.31% | 26 | 2.47% | 4 | 0.38% | 5 | 0.48% | 3 | 0.29% | 0 | 0.00% | 776 | 73.77% | 1,052 | 62.09% |
| Burleigh | 32,532 | 67.80% | 10,881 | 22.68% | 2,772 | 5.67% | 1,052 | 2.19% | 480 | 1.00% | 263 | 0.55% | 49 | 0.10% | 21,651 | 45.12% | 47,979 | 69.67% |
| Cass | 39,816 | 49.26% | 31,361 | 38.80% | 6,085 | 7.53% | 1,852 | 2.29% | 1,209 | 1.50% | 399 | 0.49% | 99 | 0.12% | 8,455 | 10.46% | 80,821 | 62.88% |
| Cavalier | 1,357 | 67.65% | 476 | 23.73% | 110 | 5.48% | 35 | 1.74% | 19 | 0.95% | 7 | 0.35% | 2 | 0.10% | 881 | 43.92% | 2,006 | 67.72% |
| Dickey | 1,667 | 69.26% | 554 | 23.02% | 123 | 5.11% | 19 | 0.79% | 23 | 0.96% | 15 | 0.62% | 6 | 0.25% | 1,113 | 46.24% | 2,407 | 61.91% |
| Divide | 867 | 71.12% | 245 | 20.10% | 71 | 5.82% | 22 | 1.80% | 9 | 0.74% | 2 | 0.16% | 3 | 0.25% | 622 | 51.02% | 1,219 | 65.18% |
| Dunn | 1,771 | 78.96% | 358 | 15.96% | 60 | 2.67% | 24 | 1.07% | 14 | 0.62% | 15 | 0.67% | 1 | 0.04% | 1,413 | 63.00% | 2,243 | 66.93% |
| Eddy | 791 | 64.26% | 355 | 28.84% | 53 | 4.31% | 10 | 0.81% | 15 | 1.22% | 6 | 0.49% | 1 | 0.08% | 436 | 35.42% | 1,231 | 68.22% |
| Emmons | 1,677 | 84.65% | 215 | 10.85% | 52 | 2.62% | 17 | 0.86% | 10 | 0.50% | 9 | 0.45% | 1 | 0.05% | 1,462 | 73.80% | 1,981 | 73.57% |
| Foster | 1,241 | 72.19% | 347 | 20.19% | 96 | 5.58% | 15 | 0.87% | 10 | 0.58% | 9 | 0.52% | 1 | 0.06% | 894 | 52.00% | 1,719 | 67.06% |
| Golden Valley | 796 | 83.18% | 99 | 10.34% | 40 | 4.18% | 11 | 1.15% | 4 | 0.42% | 7 | 0.73% | 0 | 0.00% | 697 | 72.84% | 957 | 69.58% |
| Grand Forks | 16,340 | 53.81% | 10,851 | 35.74% | 2,004 | 6.60% | 612 | 2.02% | 383 | 1.26% | 138 | 0.45% | 37 | 0.12% | 5,489 | 18.07% | 30,365 | 55.00% |
| Grant | 1,108 | 80.23% | 185 | 13.40% | 65 | 4.71% | 10 | 0.72% | 7 | 0.51% | 6 | 0.43% | 0 | 0.00% | 923 | 66.83% | 1,381 | 73.65% |
| Griggs | 847 | 66.96% | 298 | 23.56% | 93 | 7.35% | 18 | 1.42% | 6 | 0.47% | 1 | 0.08% | 2 | 0.16% | 549 | 43.40% | 1,265 | 68.73% |
| Hettinger | 1,050 | 81.02% | 168 | 12.96% | 46 | 3.55% | 17 | 1.31% | 5 | 0.39% | 9 | 0.69% | 1 | 0.08% | 882 | 68.04% | 1,296 | 64.51% |
| Kidder | 1,111 | 80.74% | 179 | 13.01% | 64 | 4.65% | 12 | 0.87% | 7 | 0.51% | 2 | 0.15% | 1 | 0.07% | 932 | 67.73% | 1,376 | 73.90% |
| LaMoure | 1,481 | 68.85% | 502 | 23.34% | 109 | 5.07% | 26 | 1.21% | 13 | 0.60% | 16 | 0.74% | 4 | 0.19% | 979 | 45.51% | 2,151 | 67.26% |
| Logan | 888 | 83.22% | 114 | 10.68% | 38 | 3.56% | 14 | 1.31% | 5 | 0.47% | 6 | 0.56% | 2 | 0.19% | 774 | 72.54% | 1,067 | 72.60% |
| McHenry | 2,050 | 72.70% | 490 | 17.38% | 189 | 6.70% | 48 | 1.70% | 20 | 0.71% | 19 | 0.67% | 4 | 0.14% | 1,560 | 55.32% | 2,820 | 63.08% |
| McIntosh | 1,100 | 76.07% | 235 | 16.25% | 71 | 4.91% | 16 | 1.11% | 10 | 0.69% | 12 | 0.83% | 2 | 0.14% | 865 | 59.82% | 1,446 | 65.61% |
| McKenzie | 3,670 | 78.55% | 698 | 14.94% | 172 | 3.68% | 66 | 1.41% | 35 | 0.75% | 28 | 0.60% | 3 | 0.06% | 2,972 | 63.61% | 4,672 | 60.82% |
| McLean | 3,860 | 72.62% | 1,081 | 20.34% | 256 | 4.82% | 57 | 1.07% | 29 | 0.55% | 24 | 0.45% | 8 | 0.15% | 2,779 | 52.28% | 5,315 | 72.59% |
| Mercer | 3,759 | 80.29% | 621 | 13.26% | 190 | 4.06% | 66 | 1.41% | 21 | 0.45% | 21 | 0.45% | 4 | 0.09% | 3,138 | 67.03% | 4,682 | 70.00% |
| Morton | 11,336 | 71.60% | 3,080 | 19.45% | 914 | 5.77% | 263 | 1.66% | 141 | 0.89% | 82 | 0.52% | 16 | 0.10% | 8,256 | 52.15% | 15,832 | 70.26% |
| Mountrail | 2,582 | 62.88% | 1,220 | 29.71% | 166 | 4.04% | 54 | 1.32% | 56 | 1.36% | 24 | 0.58% | 4 | 0.10% | 1,362 | 33.17% | 4,106 | 56.91% |
| Nelson | 1,025 | 59.70% | 536 | 31.22% | 114 | 6.64% | 22 | 1.28% | 11 | 0.64% | 9 | 0.52% | 0 | 0.00% | 489 | 28.48% | 1,717 | 71.85% |
| Oliver | 830 | 81.61% | 119 | 11.70% | 47 | 4.62% | 11 | 1.08% | 3 | 0.29% | 5 | 0.49% | 2 | 0.20% | 711 | 69.91% | 1,017 | 72.09% |
| Pembina | 2,208 | 70.03% | 681 | 21.60% | 167 | 5.30% | 55 | 1.74% | 28 | 0.89% | 12 | 0.38% | 2 | 0.06% | 1,527 | 48.43% | 3,153 | 57.10% |
| Pierce | 1,437 | 69.39% | 431 | 20.81% | 132 | 6.37% | 47 | 2.27% | 9 | 0.43% | 14 | 0.68% | 1 | 0.05% | 1,006 | 48.58% | 2,071 | 61.95% |
| Ramsey | 3,217 | 60.64% | 1,505 | 28.37% | 405 | 7.63% | 86 | 1.62% | 44 | 0.83% | 43 | 0.81% | 5 | 0.09% | 1,712 | 32.27% | 5,305 | 60.79% |
| Ransom | 1,210 | 51.29% | 838 | 35.52% | 247 | 10.47% | 37 | 1.57% | 22 | 0.93% | 4 | 0.17% | 1 | 0.04% | 372 | 15.77% | 2,359 | 57.56% |
| Renville | 993 | 76.80% | 201 | 15.55% | 71 | 5.49% | 19 | 1.47% | 4 | 0.31% | 5 | 0.39% | 0 | 0.00% | 792 | 61.25% | 1,293 | 65.44% |
| Richland | 4,767 | 62.79% | 2,064 | 27.19% | 493 | 6.49% | 123 | 1.62% | 76 | 1.00% | 54 | 0.71% | 15 | 0.20% | 2,703 | 35.60% | 7,592 | 59.68% |
| Rolette | 1,217 | 32.41% | 2,099 | 55.90% | 156 | 4.15% | 83 | 2.21% | 175 | 4.66% | 17 | 0.45% | 8 | 0.21% | -882 | -23.49% | 3,755 | 39.84% |
| Sargent | 1,088 | 54.48% | 694 | 34.75% | 167 | 8.36% | 17 | 0.85% | 18 | 0.90% | 6 | 0.30% | 7 | 0.35% | 394 | 19.73% | 1,997 | 66.52% |
| Sheridan | 650 | 82.59% | 95 | 12.07% | 29 | 3.68% | 6 | 0.76% | 1 | 0.13% | 6 | 0.76% | 0 | 0.00% | 555 | 70.52% | 787 | 73.79% |
| Sioux | 260 | 21.10% | 758 | 61.53% | 25 | 2.03% | 52 | 4.22% | 128 | 10.39% | 5 | 0.41% | 4 | 0.32% | -498 | -40.43% | 1,232 | 45.51% |
| Slope | 362 | 84.19% | 43 | 10.00% | 19 | 4.42% | 1 | 0.23% | 3 | 0.70% | 2 | 0.47% | 0 | 0.00% | 319 | 74.19% | 430 | 74.24% |
| Stark | 9,755 | 79.17% | 1,753 | 14.23% | 526 | 4.27% | 158 | 1.28% | 60 | 0.49% | 63 | 0.51% | 7 | 0.06% | 8,002 | 64.94% | 12,322 | 54.34% |
| Steele | 538 | 53.85% | 361 | 36.14% | 75 | 7.51% | 12 | 1.20% | 6 | 0.60% | 7 | 0.70% | 0 | 0.00% | 177 | 17.71% | 999 | 67.10% |
| Stutsman | 6,718 | 66.15% | 2,498 | 24.60% | 574 | 5.65% | 188 | 1.85% | 109 | 1.07% | 55 | 0.54% | 13 | 0.13% | 4,220 | 41.55% | 10,155 | 61.49% |
| Towner | 733 | 63.35% | 305 | 26.36% | 90 | 7.78% | 19 | 1.64% | 7 | 0.61% | 3 | 0.26% | 0 | 0.00% | 428 | 36.99% | 1,157 | 66.28% |
| Traill | 2,265 | 57.59% | 1,241 | 31.55% | 292 | 7.42% | 62 | 1.58% | 35 | 0.89% | 36 | 0.92% | 2 | 0.05% | 1,024 | 26.04% | 3,933 | 64.05% |
| Walsh | 2,995 | 64.60% | 1,167 | 25.17% | 330 | 7.12% | 88 | 1.90% | 32 | 0.69% | 23 | 0.50% | 1 | 0.02% | 1,828 | 39.43% | 4,636 | 56.27% |
| Ward | 18,636 | 67.98% | 5,806 | 21.18% | 2,055 | 7.50% | 496 | 1.81% | 242 | 0.88% | 152 | 0.55% | 25 | 0.09% | 12,830 | 46.80% | 27,412 | 52.00% |
| Wells | 1,796 | 75.37% | 419 | 17.58% | 101 | 4.24% | 28 | 1.17% | 14 | 0.59% | 23 | 0.97% | 2 | 0.08% | 1,377 | 57.79% | 2,383 | 71.93% |
| Williams | 10,069 | 78.62% | 1,735 | 13.55% | 631 | 4.93% | 219 | 1.71% | 74 | 0.85% | 74 | 0.85% | 5 | 0.04% | 8,334 | 65.07% | 12,807 | 54.16% |
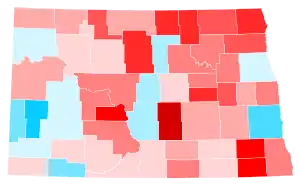
Counties that flipped from Democratic to Republican
By congressional district
Due to the state's low population, only one congressional district is allocated. This district is called the At-Large district, because it covers the entire state, and thus is equivalent to the statewide election results.
| District | Trump | Clinton | Representative |
|---|---|---|---|
| At-large | 62.96% | 27.23% | Kevin Cramer |
Analysis
Republican nominee Donald Trump won North Dakota in a 36-percentage-point routing over Democratic rival Hillary Clinton, thus carrying the state's 3 electoral votes.[18] Like many neighboring majority-white, largely rural Great Plains and prairie states, North Dakota has not supported a Democratic candidate for president since Lyndon B. Johnson in 1964.
North Dakota politics are dominated by the farm, with a largely white and older populace who are socially conservative. Though the state's farming population has briefly flirted with populism, that movement is now mostly faded from North Dakota politics, as farms in North Dakota are no longer tilled by solitary yeoman and are no longer family-owned as much, and are replaced by agribusinesses.[19]
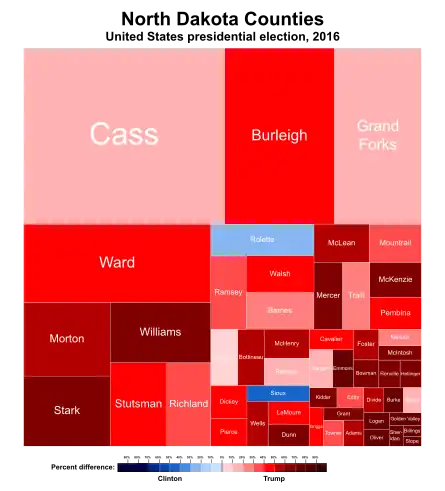
In recent presidential elections, Bakken shale oil has been a major driver of conservative success in the state, as its economy is increasingly fueled by the North Dakota oil boom and its population grows suspect of the environmental movement championed by Democrats. The main oil boom has taken place in the counties west and northwest of Bismarck, where Donald Trump won sometimes north of 80% of the vote.[19]
Donald Trump won in Grand Forks County which contains the city of Grand Forks, in Cass County which contains the city of Fargo, and in Burliegh County which contains the capital city of Bismarck. He also swept most of the rural and deeply conservative counties of the state, sometimes taking more than 80% of the vote in a county. Clinton won resoundingly in Sioux County, which is majority Native American and is the site of the Dakota Access Pipeline Protest by its inhabitants, the Sioux Indian tribe.
See also
References
- "Distribution of Electoral Votes". National Archives and Records Administration. September 19, 2019. Retrieved December 14, 2020.
- Jaeger, Alvin. "North Dakota...The Only State Without Voter Registration" (PDF).
- Nowatzki, Mike. "With ND Republicans unable to cast votes for presidential nominee, Cramer launches online straw poll". Forum of Fargo-Moorhead. Retrieved February 26, 2016.
- "2016 Presidential Election Statistics". Dave Leip's Atlas of U.S. Presidential Elections. Retrieved March 5, 2018.
- "North Dakota Election Results 2016". The New York Times. August 2017.
- "North Dakota Republican Delegation 2016".
- "Our final map has Clinton winning with 352 electoral votes. Compare your picks with ours". Los Angeles Times. November 6, 2016. Retrieved November 13, 2016.
- "Road to 270: CNN's general election map - CNNPolitics.com". Cnn.com. November 8, 2016. Retrieved November 13, 2016.
- "Larry J. Sabato's Crystal Ball » 2016 President". Centerforpolitics.org. November 7, 2016. Retrieved November 13, 2016.
- Todd, Chuck. "NBC's Final Battleground Map Shows Clinton With a Significant Lead". NBC News. Retrieved November 13, 2016.
- "2016 Election Maps - Battle for White House". RealClearPolitics. Retrieved November 13, 2016.
- "Electoral Scorecard: Map shifts again in Trump's favor, as Clinton holds edge". Fox News. November 7, 2016. Retrieved November 13, 2016.
- "The Final 15: The Latest Polls in the Swing States That Will Decide the Election". Abcnews.go.com. November 7, 2016. Retrieved November 13, 2016.
- North Dakota Secretary of State (November 18, 2016). "Official 2016 General Election Results – Statewide". Retrieved November 14, 2021.
- "Secretary of State - Election Night Results". results.sos.nd.gov. Retrieved June 18, 2017.
- "Secretary of State - Voter Turnout". results.sos.nd.gov. Retrieved June 18, 2017.
- Bump, Philip. "The counties that flipped parties to swing the 2016 election". Washington Post. ISSN 0190-8286. Retrieved September 1, 2020.
- "North Dakota Election Results 2016". The New York Times. Retrieved November 12, 2016.
- Cohen, Micah (October 14, 2012). "An Extra Ingredient in North Dakota Politics: Oil". FiveThirtyEight. Retrieved November 12, 2016.
External links
- RNC 2016 Republican Nominating Process Archived 2016-11-08 at the Wayback Machine
- Green papers for 2016 primaries, caucuses, and conventions