1998 Stevenage Borough Council election
Elections to Stevenage Council were held on 7 May 1998. One third of the council was up for election; the seats which were last contested in 1994. The Labour Party stayed in overall control of the council.
| |||||||||||||||||||||||||
13 of the 39 seats to Stevenage Borough Council 20 seats needed for a majority | |||||||||||||||||||||||||
|---|---|---|---|---|---|---|---|---|---|---|---|---|---|---|---|---|---|---|---|---|---|---|---|---|---|
| Turnout | 26.0% | ||||||||||||||||||||||||
| |||||||||||||||||||||||||
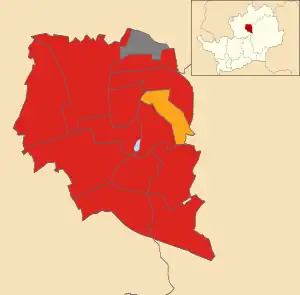 Map showing the results of contested wards in the 1998 Stevenage Borough Council elections. | |||||||||||||||||||||||||
| |||||||||||||||||||||||||
After the election, the composition of the council was:
- Labour 37
- Liberal Democrat 2
Election result
| Party | Seats | Gains | Losses | Net gain/loss | Seats % | Votes % | Votes | +/− | |
|---|---|---|---|---|---|---|---|---|---|
| Labour | 12 | 0 | 1 | 92.3 | 62.5 | 9,144 | |||
| Liberal Democrats | 1 | 1 | 0 | 7.7 | 15.8 | 2,305 | |||
| Conservative | 0 | 0 | 0 | 0 | 0 | 21.5 | 3,144 | ||
| Socialist Alternative | 0 | 0 | 0 | 0 | 0 | 0.2 | 35 | New | |
All comparisons in seats and vote share are to the corresponding 1994 election.
Ward results
Bandley Hill

Location of Bandley Hill ward
| Party | Candidate | Votes | % | |
|---|---|---|---|---|
| Labour | Jacqueline Hollywell | 925 | 71.0% | |
| Conservative | Freda Warner | 206 | 15.8% | |
| Liberal Democrats | Gordon Knigh | 136 | 10.4% | |
| Socialist Alternative | Mark Pickersgill | 35 | 2.7% | |
| Turnout | 20.8% | |||
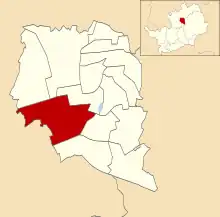
| Labour hold | ||||
Bedwell Plash

Location of Bedwell Plash ward
| Party | Candidate | Votes | % | |
|---|---|---|---|---|
| Labour | William Lawrence | 729 | 73.9% | |
| Conservative | Victoria Greaves | 147 | 14.9% | |
| Liberal Democrats | Peter Wilkins | 110 | 11.2% | |
| Turnout | 26.3% | |||
| Labour hold | ||||
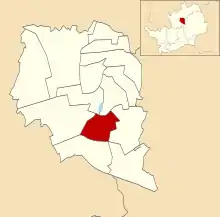
Chells
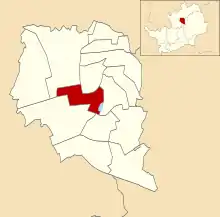
Location of Chells ward
| Party | Candidate | Votes | % | |
|---|---|---|---|---|
| Labour | Pamela Stuart | 508 | 70.1% | |
| Liberal Democrats | Leonard Lambert | 125 | 17.2% | |
| Conservative | Gwen Hegan | 92 | 12.7% | |
| Turnout | 21.9% | |||
| Labour hold | ||||
Longmeadow
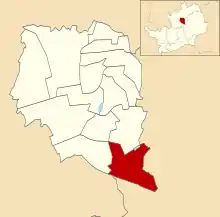
Location of Longmeadow ward
| Party | Candidate | Votes | % | |
|---|---|---|---|---|
| Labour | Ann Webb | 767 | 61.3% | |
| Conservative | Matthew Hurst | 272 | 21.7% | |
| Liberal Democrats | Margaret Latham | 212 | 16.9% | |
| Turnout | 25.4% | |||
| Labour hold | ||||
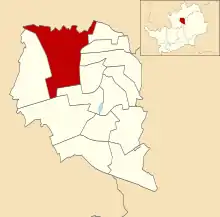
Martins Wood

Location of Martins Wood ward
| Party | Candidate | Votes | % | |
|---|---|---|---|---|
| Labour | Gary Marshall | 853 | 47.6% | |
| Conservative | Stuart Greaves | 706 | 39.4% | |
| Liberal Democrats | Elisabeth Knight | 234 | 13.1% | |
| Turnout | 22.7% | |||
| Labour hold | ||||
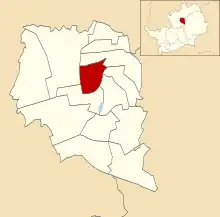
Mobbsbury
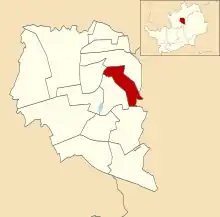
Location of Mobbsbury ward
| Party | Candidate | Votes | % | |
|---|---|---|---|---|
| Liberal Democrats | Graham Snell | 617 | 47.7% | |
| Labour | Gillian Tuffin | 614 | 47.4% | |
| Conservative | Matthew Wyatt | 63 | 4.9% | |
| Turnout | 41.7% | |||
| Liberal Democrats gain from Labour | ||||
Monkswood
Location of Monkswood ward
| Party | Candidate | Votes | % | |
|---|---|---|---|---|
| Labour | David Cullen | 463 | 77.0% | |
| Liberal Democrats | George Robbins | 70 | 11.6% | |
| Conservative | Alexandra Young | 68 | 11.3% | |
| Turnout | 27.1% | |||
| Labour hold | ||||
Old Stevenage
Location of Old Stevenage ward
| Party | Candidate | Votes | % | |
|---|---|---|---|---|
| Labour | Hugh Tessier | 944 | 53.5% | |
| Conservative | Jean Carter | 615 | 34.9% | |
| Liberal Democrats | David Williams | 205 | 11.6% | |
| Turnout | 30.5% | |||
| Labour hold | ||||
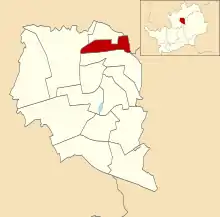
Pin Green
Location of Pin Green ward
| Party | Candidate | Votes | % | |
|---|---|---|---|---|
| Labour | Reginald Smith | 616 | 72.0% | |
| Conservative | Marion Mason | 145 | 16.9% | |
| Liberal Democrats | Victoria Kelleher | 95 | 11.1% | |
| Turnout | 24.2% | |||
| Labour hold | ||||
Roebuck
Location of Roebuck ward
| Party | Candidate | Votes | % | |
|---|---|---|---|---|
| Labour | Brian Dunnell | 654 | 66.2% | |
| Conservative | Claire Halling | 204 | 20.6% | |
| Liberal Democrats | Cecil Lewis | 130 | 13.2% | |
| Turnout | 24.5% | |||
| Labour hold | ||||
St Nicholas
Location of St Nicholas ward
| Party | Candidate | Votes | % | |
|---|---|---|---|---|
| Labour | Stanley Munden | 439 | 53.6% | |
| Conservative | Sheila Woods | 201 | 24.5% | |
| Liberal Democrats | Mary Griffith | 179 | 21.9% | |
| Turnout | 23.2% | |||
| Labour hold | ||||
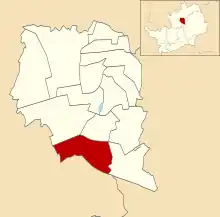
Shephall
Location of Shephall ward
| Party | Candidate | Votes | % | |
|---|---|---|---|---|
| Labour | Eddie Webb | 583 | 82.8% | |
| Conservative | Sheree Huetson | 69 | 9.8% | |
| Liberal Democrats | Heather Snell | 52 | 7.4% | |
| Turnout | 22.5% | |||
| Labour hold | ||||
Symonds Green
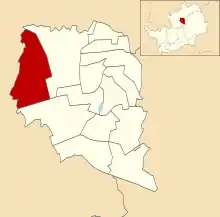
Location of Symonds Green ward
| Party | Candidate | Votes | % | |
|---|---|---|---|---|
| Labour | David Kissane | 1,049 | 67.9% | |
| Conservative | Peter McPartland | 356 | 23.0% | |
| Liberal Democrats | Sydney Grubert | 140 | 9.1% | |
| Turnout | 26.6% | |||
| Labour hold | ||||
References
- "Council compositions by year". The Elections Centre.
- "Local Election Summaries 1998". The Elections Centre.
- "Stevenage Borough Council Election Results 1973-2012" (PDF). Retrieved 11 July 2019.
- "Stevenage Borough Council Election Results 1998". Stevenage Borough Council. Archived from the original on 10 June 1998. Retrieved 1 August 2019.
This article is issued from Wikipedia. The text is licensed under Creative Commons - Attribution - Sharealike. Additional terms may apply for the media files.