Overview
At the center of the UI is a node-graph. In the screenshot above the node-graph has 2 nodes connected to each other through a curved line. The connection represents the data flow. Data flowing through the nodes are video or images. Each node applies some processing to the input data.
Each node has 2 buttons, a squared button on the left and a circled button on the right. Note that left button is green when toggled and the right button is blue when toggled. The same green and blue is used together with the node name at the top left of the screenshot.
Understanding the Node-graph
In the explanation below we will use sketch images instead of Mewa screenshots to bring to attention only the graphical features necessary to understand Mewa.
In the node-graph data flows from top down. If the top most node is a video, the nodes below, connected to it, apply a filter to all frames of the video.
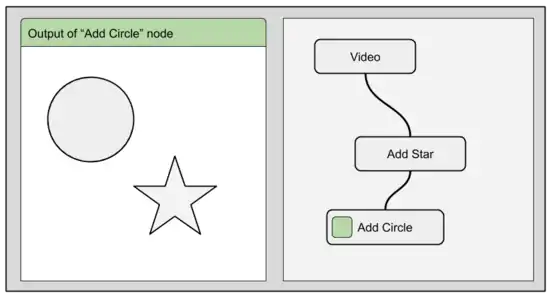
The sketches below show a node-graph with 3 nodes. The top most node represents a video. The node below adds a star on top of the video, and the last node adds a circle on top of the video+star.
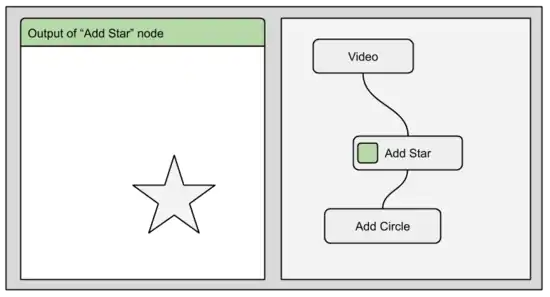
When toggling the node left button (green button), the output of the respective node is shown on the output window (window at the left).
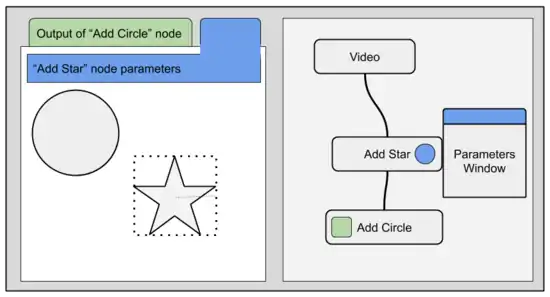
When toggling the “Add Star” node parameters (blue button), the parameters window appears, as the controls that allow resizing the star appear in the output window.
Understanding the Time-view
The node-graph, as seen above, behaves the same for all frames. To change the node-graph behaviour for different frames, through time, we use the time-view
The sketches below show a node-graph with 2 nodes. The video node at the top represents a video file, and the Move2D node below applies a resize/scaling to the video file.
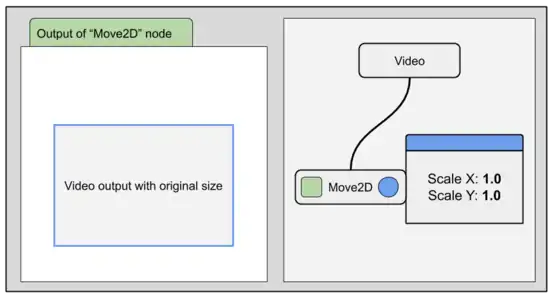
The scale values are shown in the node window (also called node parameters window).
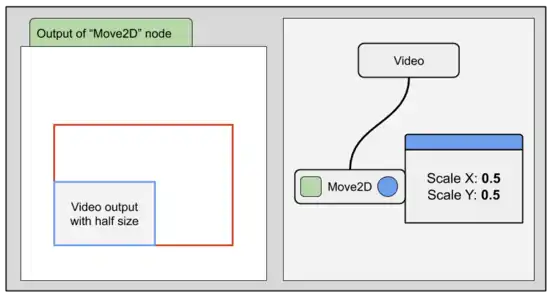
The user can change the scale values by changing the values on the parameters window and/or resizing the image in the output window.
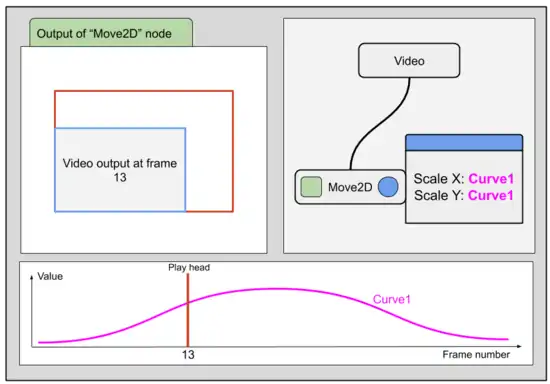
To animate the image size we create a curve. The curve holds the scale values for each frame. The user navigates through frames dragging the play head.
Let's try
Importing footage
Mewa performs operations over images, and these can be still images or videos. For a more generic term we will call it footage.
Let's start importing footage by clicking ![]()
![]()
Below is a screenshot of Mewa with the File Browser open.
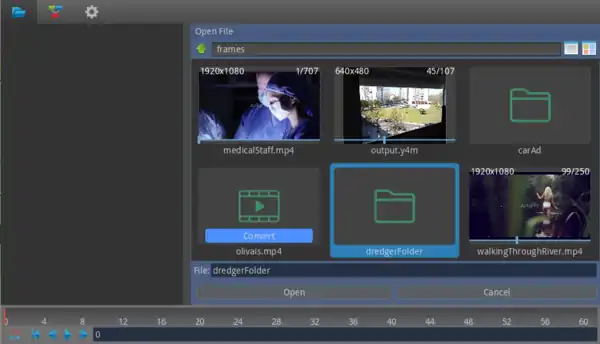
With the File Browser it's possible to load video files and image sequences as well. An image sequence is a group of files which are consecutively numbered.
Thumbnails are immediately available to image sequences.
For video files a convert button is shown. That's because the file needs to be converted into a Mewa friendly format. Click on the convert button to start the conversion. Once the conversion is complete a thumbnail of the video file is shown.
Converted video files and image sequences show a slider just below the thumbnail. Use it to scroll through the different frames.
Press ok after selecting the footage you wish to import.
Once the footage has been imported it appears as a new node in the node graph.
Add nodes
We have now our first node in the node graph, a footage node.
Let's view how the footage node is layed out in the time-view. Click on ![]()
![]()
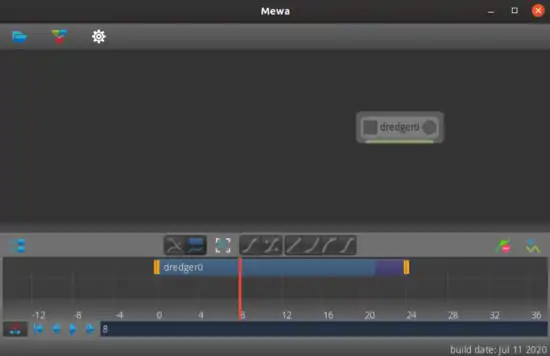
The horizontal bar's length is exactly the number of frames in the footage file.
Every footage node can be independently positioned in the time-view. Dragging the footage bar changes the time the footage start. The footage length can be trimmed by dragging the right edge of the bar. It's also possible to hold the first frame by adjusting the left handler of the bar.
Now let's add an effect to our footage node. In the action bar, at the top, click on the node library button ![]()
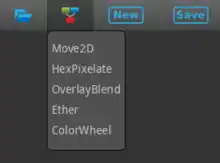
Select the HexagonalPixelate option. A new node called hexagonalPixelate0 is shown next to the footage button.
Nodes can be dragged and moved anywhere inside the nodegraph window. Drag the hexagonalPixelate0 node below the footage node. To apply the HexagonalPixelate effect on the footage node connect the footage node output to the input of hexagonalPixelate0 as shown in the spicture below. Connections describe the workflow execution. The workflow is executed in a top down order, from outputs to inputs.
Inside the nodes there are 2 buttons. On the left side, with a rectangular shape is the output button. On the right side, with a circular shape is the parameters button. With the node buttons we can inspect the output of nodes. The parameter button opens the node's parameters window containing all the modifiable parameters of the node.
Inspect Output
Clicking on the output button of hexagonalPixelate0 node (the square button on the left side of the node) the output window opens showing the output of hexagonalPixelate0 node.
The output window shows the output image of the last clicked output button.
Notice that the output image has a red rectangle around it. The red rectangle represents the output size. Processing operations are preformed inside the red rectangle only.
That size is set in the bottom right corner of the output window. The output size determines the output image size of all nodes.
Final note
The node graph provides a top down "schematic" view of operations applied over images. With an image (footage node) as the top most node, image processing operations are performed by the connected nodes below. Image data is passed top-down, from one node to the next node connected to it. This structure of nodes illustrates the operations and the order of operations applied.
The advantage of using a node graph is it makes possible to edit the parameters of any node while visualising the output of any node simultaneously.