< GENtle
Dot plot.
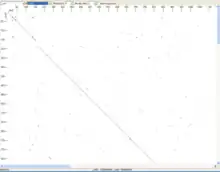
Dot plots can be generated in GENtle between two DNA sequences, which can be selected from drop-down lists in the toolbar. The calculation of the dot plot will start immediately and take a few seconds, depending on the length of the sequences.
A window size and a mismatch limit can be chosen as pararmeters for the dot plot. A click into the plot will take you to the respective position in sequence 1 (the first dropdown box), unless "Open sequence 2" is selected.
Either sequence can be opened via the context menu at the respective position. Also, the plot image can be copied or saved via the context menu.
This article is issued from Wikibooks. The text is licensed under Creative Commons - Attribution - Sharealike. Additional terms may apply for the media files.