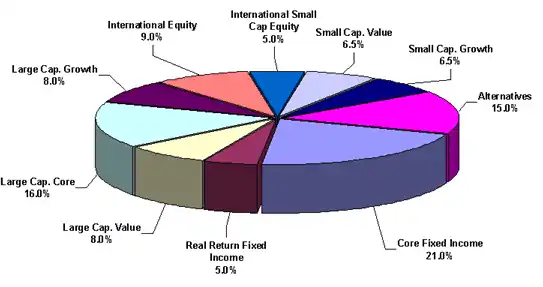
I am trying to make a comprehensive list of based on a 20 to 50 year data set in regard to a 5, 10, & 20 year time period for the following Asset Class which use a Bottom-Up Market Segment approach will entail their Average Annual Rate of Return, Standard Deviation, Average Beta, and a corresponding Indices that go with it. This page is geared towards the U.S. Economy.
Cash-Equivalents
| Type | Maturity | Default Risk | Average Rate of Return | Average Standard Deviation | Average Beta | Indices | ||||||
|---|---|---|---|---|---|---|---|---|---|---|---|---|
| Blank | Blank | Blank | 5yr | 10yr | 20yr | 5yr | 10yr | 20yr | 5yr | 10yr | 20yr | Blank |
| Treasury Bill | 4-Week Bill | None | ||||||||||
| Treasury Bill | 13-Week Bill | None | ||||||||||
| Treasury Bill | 26-Week Bill | None | ||||||||||
| Treasury Notes | 2 years | None | ||||||||||
| Treasury Notes | 3 years | None | ||||||||||
| Treasury Notes | 5 years | None | ||||||||||
| Treasury Notes | 10 years | None | ||||||||||
| TIPS | 5 years | None | ||||||||||
| TIPS | 10 years | None | ||||||||||
| TIPS | 20 years | None | ||||||||||
Fixed Income
Corporate Bonds
| Type | Maturity | Default Risk | Average Rate of Return | Average Standard Deviation | Average Beta | Indices | ||||||
|---|---|---|---|---|---|---|---|---|---|---|---|---|
| Blank | Blank | Blank | 5yr | 10yr | 20yr | 5yr | 10yr | 20yr | 5yr | 10yr | 20yr | Blank |
| Corporate | Short Term | Aaa/AAA | ||||||||||
| Corporate | Short Term | Aa/AA | ||||||||||
| Corporate | Short Term | A/A | ||||||||||
| Corporate | Short Term | Baa/BBB | ||||||||||
| Corporate | Inter-Med Term >10 | Aaa/AAA | ||||||||||
| Corporate | Inter-Med Term >10 | Aa/AA | ||||||||||
| Corporate | Inter-Med Term >10 | A/A | ||||||||||
| Corporate | Inter-Med Term >10 | Baa/BBB | ||||||||||
| Corporate | Long Term 10< | Aaa/AAA | ||||||||||
| Corporate | Long Term 10< | Aa/AA | ||||||||||
| Corporate | Long Term 10< | A/A | ||||||||||
| Corporate | Long Term 10< | Baa/BBB | ||||||||||
Equities
Stocks
| Large-cap: market cap exceeds US$5 billion | Mid-cap: market cap between US$1 billion and US$5 billion | Small-cap: market cap below US$1 billion | Micro-cap: market cap under US$100 million |
|---|---|---|---|
I would further categorize the stocks into Value & Growth, but the decision to allocate these investments are very subjective, and in regard to a mutual fund the decision ultimately rests with the mutual fund manager to determine. Also common among mutual funds what is considered to be large-cap growth can actally have an allocation of 40% small-cap value and 60% large-cap growth and still be considered "Large-Cap Growth" thus defining and analyzing would succumb to an individual selection basis, which the investor can do by himself.
Domestic Corporate Stocks
| Type | Market-Cap | Average Rate of Return | Average Standard Deviation | Average Beta | Indices | ||||||
|---|---|---|---|---|---|---|---|---|---|---|---|
| Blank | Blank | 5yr | 10yr | 20yr | 5yr | 10yr | 20yr | 5yr | 10yr | 20yr | Blank |
| Domestic | Large-Cap | ||||||||||
| Domestic | Mid-Cap | ||||||||||
| Domestic | Small-Cap | ||||||||||
| Domestic | Micro-Cap | ||||||||||