< Algebra
Inequalities in 2 variables
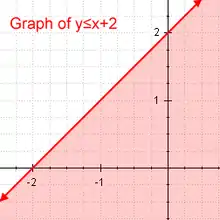
A graph of an inequality in 2 variables.
Linear inequalities in 2 variables are typically in the form of , where m is the slope of the line and b is the y-intercept.

Graphing an inequality is easy. First, graph the inequality as if it were an equation. If the sign is ≤ or ≥, graph a normal line. If it is > or <, then use a dotted or dashed line. Then, shade either above or below the line, depending on if y is greater or less than mx + b.
This article is issued from Wikibooks. The text is licensed under Creative Commons - Attribution - Sharealike. Additional terms may apply for the media files.